水球图的使用
注意:
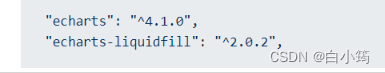
echarts-liquidfill@3 版本匹配 echarts@5 版本,echarts-liquidfill@2 版本匹配 echarts@4 版本
npm install echarts-liquidfill@2.0.2 --save
vue代码演示:
<template>
<div class="com-container"><div class="com-chart" ref="trend_ref"></div>
</div>
</template><script>
import * as echarts from "echarts";
import echartsLiquidfill from "echarts-liquidfill"; //在这里引入水球图
export default {data() {return {};},mounted() {this.init();},methods: {init() {var mycharts = echarts.init(this.$refs.trend_ref);//这里只能使用echarts.init不能使用$ehartsvar value = 0.45;var value1 = 0.76;var data = [value, value1];var option = {backgroundColor: "#0F224C",title: [{text: "本年收缴率",x: "22%",y: "70%",textStyle: {fontSize: 14,fontWeight: "100",color: "#5dc3ea",lineHeight: 16,textAlign: "center"}},{text: "本月收缴率",x: "73%",y: "70%",textStyle: {fontSize: 14,fontWeight: "100",color: "#5dc3ea",lineHeight: 16,textAlign: "center"}}],series: [{type: "liquidFill",radius: "47%",center: ["25%", "45%"],color: [{type: "linear",x: 0,y: 0,x2: 0,y2: 1,colorStops: [{offset: 0,color: "#446bf5"},{offset: 1,color: "#2ca3e2"}],globalCoord: false}],data: [value, value], // data个数代表波浪数backgroundStyle: {borderWidth: 1,color: "RGBA(51, 66, 127, 0.7)"},label: {normal: {textStyle: {fontSize: 50,color: "#fff"}}},outline: {// show: falseborderDistance: 0,itemStyle: {borderWidth: 2,borderColor: "#112165"}}},{//第二个球的填充type: "liquidFill",radius: "47%",center: ["75%", "45%"],color: [{type: "linear",x: 0,y: 0,x2: 0,y2: 1,colorStops: [{offset: 0,color: "#2aa1e3"},{offset: 1,color: "#08bbc9"}],globalCoord: false}],data: [value1, value1], // data个数代表波浪数backgroundStyle: {borderWidth: 1,color: "RGBA(51, 66, 127, 0.7)"},label: {normal: {textStyle: {fontSize: 28,color: "#fff"}}},outline: {// show: falseborderDistance: 0,itemStyle: {borderWidth: 2,borderColor: "#112165"}}}],tooltip: {//鼠标滑过展示数据show: false}};mycharts.setOption(option);}}
};
</script>
<style>
</style>