Echarts学习之——水球图(echarts-liquidfill)
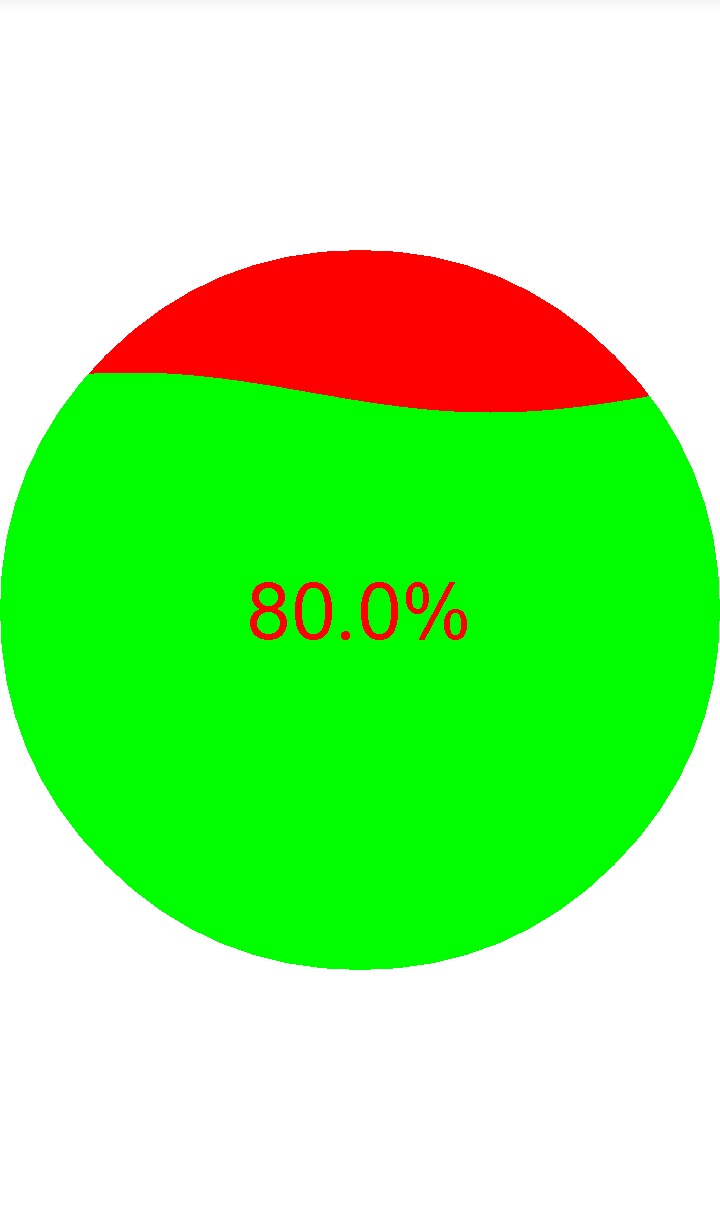
水球图(Liquid Fill Chart)是填充仪表盘的一种,适合于展现单个百分比数据的图表类型。一般用以于显示利润,回款等财务指标。

安装
npm i echarts
npm i echarts-liquidfill
注意:echarts-liquidfill@3版本匹配echarts@5版本,echarts-liquidfill@2版本匹配echarts@4版本
举个栗子
import echarts from "echarts";
import "echarts-liquidfill";initChart(){let myLiuqiud = this.$echarts.init(document.getElementById("liqiud"));var value = 0.54;let option = {backgroundColor: "#000", //背景色title: {text: value + "%",textStyle: {fontSize: 20,fontFamily: "Microsoft Yahei",fontWeight: "normal",color: "#fff",},x: "center",y: "48%",},series: [{type: "liquidFill", //配置echarts图类型radius: "60%",center: ["50%", "50%"],//  shape: 'roundRect',// 设置水球图类型(矩形[rect],菱形[diamond],三角形[triangle],水滴状[pin],箭头[arrow]...) 默认为圆形data: [0.5, 0.5],  //设置波浪的值 //waveAnimation:false, //静止的波浪backgroundStyle: {borderWidth: 1,color: "transparent",//水球图内部背景色},outline: { borderDistance: 10, itemStyle: {borderWidth: 4,borderColor: "#5acef2",},},color: [ //波浪颜色{type: "linear",x: 0,y: 0,x2: 0,y2: 1,colorStops: [{offset: 1,color: "rgba(6, 187, 112, 0.3)", //下},{offset: 0,color: "rgba(11, 201, 199, 0.3)",},],globalCoord: false,},{type: "linear",x: 0,y: 0,x2: 0,y2: 1,colorStops: [{offset: 1,color: "rgba(6, 187, 112, 1)", //下},{offset: 0,color: "rgba(11, 201, 199, 1)",},],globalCoord: false,},],label: {normal: {formatter: "",},},},],};myLiuqiud.setOption(option);}