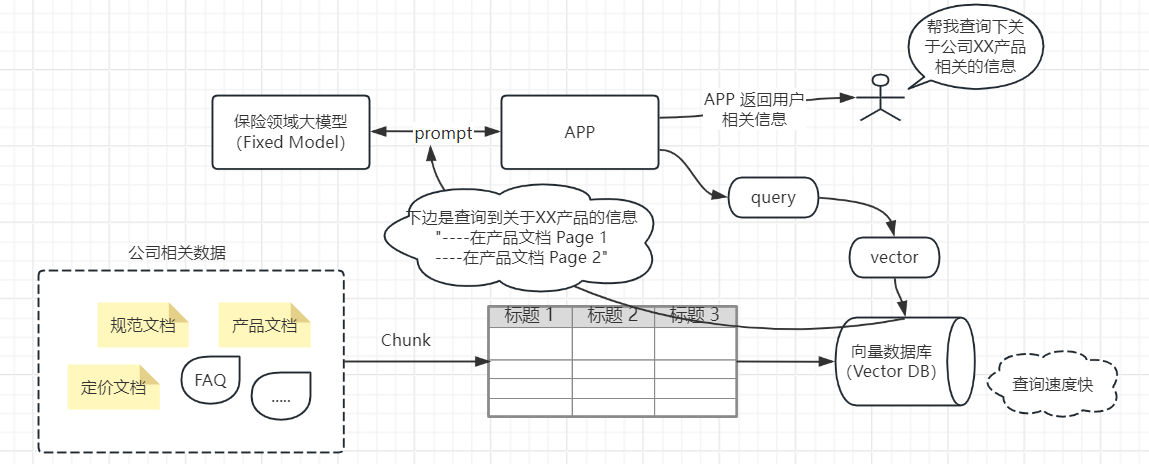
这个可视化大屏分为四个部分
一个引入代码,引入全局 index.vue.
左边代码centerleft.vue
右边代码centerright.vue
中间代码center.vue

主代码:
这是一段 Vue 框架的代码。
在 <template> 部分:
- 定义了一个根
div元素。 - 其中包含一个名为
env_content的div元素,它内部包含三个自定义组件envLeft、envCenter和envRight。
在 <script> 部分:
- 引入了三个组件:
envLeft.vue、envCenter.vue和envRight.vue。 - 定义了默认的导出对象,其中
components属性中注册了这三个引入的组件。
在 <style scoped> 部分:
- 为
env_content类定义了样式,使用flex布局,并设置了元素之间的间距为space-between,实现了三个子元素在水平方向上两端对齐的布局效果。
总体来说,这段代码通过组件化的方式构建了一个页面结构,并使用样式进行了布局设置。
<template><div><div class="env_content"><env-left /><env-center /><env-right /></div></div>
</template><script>
import envLeft from "./components/envLeft.vue";
import envRight from "./components/envRight.vue";
import envCenter from "./components/envCenter.vue";
export default {components: { envLeft, envCenter, envRight },
};
</script><style scoped>
.env_content {display: flex;justify-content: space-between;
}
</style>
左边代码
模板(<template>)部分:
- 整体被一个具有
content类的div包裹。- 内部的第一个
div中包含一个自定义组件dv-border-box-8,其内部有一个head部分。head中又包含三个具有head_content类的div,每个内部都有一个h1和h2元素,分别展示不同的风力、风速和光照数据。
- 第二个
div具有body类,包含两个部分。- 第一个部分是一个自定义组件
dv-border-box-6,内部使用Echart组件来展示风速监测图表,并通过options1对象配置了图表的各种属性,如颜色、标题、提示框、图例、工具框、网格、坐标轴和数据系列等。 - 第二个部分是一个自定义组件
dv-border-box-10,内部通过dv-scroll-board组件展示城市空气污染物监测数据。
- 第一个部分是一个自定义组件
- 内部的第一个
脚本(<script>)部分:
- 引入了
Echart组件和echarts库。 - 定义了默认导出对象。
components中注册了Echart组件。data函数返回了两个数据对象:options1用于配置风速监测图表,airData用于提供城市空气污染物监测数据。
样式(<style scoped>)部分:
content类的div宽度设置为 30% 。head类的div有内边距、高度,并使用flex布局实现元素之间的等间距排列。head_content类的div使用flex-direction: column实现纵向布局,并通过justify-content: space-between和align-items: center来调整内部元素的垂直和水平对齐方式。body类的div有上边距。
总体而言,这段代码构建了一个展示风力、风速、光照以及风速和城市空气污染物监测数据的页面组件,并通过配置数据和样式来呈现相应的内容和布局。
<template><div class="content"><div><dv-border-box-8 :reverse="true"><div class="head"><div class="head_content"><h1>2.5</h1><h2>风力(级)</h2></div><div class="head_content"><h1>5</h1><h2>风速(m/s)</h2></div><div class="head_content"><h1>45</h1><h2>光照(klm)</h2></div></div></dv-border-box-8></div><div class="body"><!-- 风速监测表 --><dv-border-box-6><Echart :options="options1" height="500px"/></dv-border-box-6><!-- 城市空气污染物监测表 --><dv-border-box-10><div style="padding: 5px"><dv-scroll-board :config="airData" style="height: 300px" /></div></dv-border-box-10></div></div>
</template><script>
import Echart from "@/common/echart/index.vue";
import * as echarts from "echarts";
export default {components: { Echart },data() {return {options1: {color: ["#80FFA5"],title: {text: "24小时风速监测",},tooltip: {trigger: "axis",axisPointer: {type: "cross",label: {backgroundColor: "#6a7985",},},},legend: {data: ["air spend"],},toolbox: {feature: {saveAsImage: {},},},grid: {left: "3%",right: "4%",bottom: "3%",containLabel: true,},xAxis: [{name: "h",type: "category",boundaryGap: false,data: [0, 2, 4, 6, 8, 10, 12, 14, 16, 18, 20, 22, 24],},],yAxis: [{name: "风速m/s",type: "value",min: 0,max: 6,},],series: [{type: "line",stack: "Total",smooth: true,lineStyle: {width: 0,},showSymbol: false,areaStyle: {opacity: 0.8,color: new echarts.graphic.LinearGradient(0, 0, 0, 1, [{offset: 0,color: "rgb(128, 255, 165)",},{offset: 1,color: "rgb(1, 191, 236)",},]),},emphasis: {focus: "series",},data: [1, 1.3, 1.1, 0.8, 2.4, 3.5, 3.1, 1.2, 2.5, 4.2, 3.2, 1.5, 0.9,],},],},airData: {header: ["城市", "首要污染物", "等级", "AQI"],data: [["平桥区区", "——", "优", 34],["浉河区区", "——", "优", 31],["罗山县", "O3", "轻度污染", 94],["息县", "PM2.5", "良", 52],["光山县", "——", "优", 34],["新县", "——", "优", 31],["潢川县", "O3", "轻度污染", 94],["商城县", "PM2.5", "良", 52],["淮滨县", "——", "优", 31],["固始县", "O3", "轻度污染", 94]],},};},
};
</script><style scoped>
.content {width: 30%;
}
.head {padding: 10px;height: 80px;display: flex;justify-content: space-around;
}
.head_content {display: flex;flex-direction: column;justify-content: space-between;align-items: center;
}
.body {margin-top: 10px;
}
</style>
效果:

右边代码
模板(<template>)部分:
- 整体由一个具有
content类的div包裹。- 第一个
div内包含一个自定义的dv-border-box-8组件,其内部有head部分,head又包含三个具有head_content类的div,分别展示了 PM2.5、PM10 和 TSP 的数据及对应的单位。 - 第二个
div具有body类,包含两个主要部分。- 第一个部分是
body_table1类的div,其中包含一个自定义的dv-border-box-6组件,展示了标题“主要污染物分布”和使用Echart组件绘制的饼图。 - 第二个部分是另一个自定义的
dv-border-box-6组件,展示了标题“空气污染物监测”和使用Echart组件绘制的不同污染物在不同月份的折线图。
- 第一个部分是
- 第一个
脚本(<script>)部分:
- 引入了
Echart组件。 - 定义了默认导出对象。
components中注册了Echart组件。data函数返回了两个options对象:options1用于配置主要污染物分布的饼图,options2用于配置空气污染物监测的折线图。
样式(<style scoped>)部分:
content类的div宽度设置为 30% 。head类的div有内边距、高度,并使用flex布局实现元素之间的等间距排列。head_content类的div使用纵向的flex布局,并调整内部元素的垂直和水平对齐方式。body类的div有上边距。body_table1类的div使用flex布局。
<template><div class="content"><div><dv-border-box-8 :reverse="true"><div class="head"><div class="head_content"><h1>35</h1><h2>PM2.5(μg/m³)</h2></div><div class="head_content"><h1>75</h1><h2>PM10(mg/m³)</h2></div><div class="head_content"><h1>125</h1><h2>TSP(mg/m³)</h2></div></div></dv-border-box-8></div><div class="body"><!-- 城市空气污染物比例占比 --><div class="body_table1"><dv-border-box-6 style="padding: 10px"><h2>主要污染物分布</h2><Echart:options="options1"height="400px"width="400px"style="margin: auto"/></dv-border-box-6></div><!-- 城市空气污染物监测 --><div><dv-border-box-6 style="padding: 10px"><h2>空气污染物监测</h2><Echart :options="options2" height="340px" width="500px" /></dv-border-box-6></div></div></div>
</template><script>
import Echart from "@/common/echart/index.vue";
export default {components: { Echart },data() {return {options1: {legend: {top: "bottom",},toolbox: {show: true,feature: {mark: { show: true },dataView: { show: true, readOnly: false },restore: { show: true },saveAsImage: { show: true },},},series: [{name: "Nightingale Chart",type: "pie",radius: [50, 180],center: ["50%", "50%"],roseType: "area",itemStyle: {borderRadius: 8,},data: [{ value: 15, name: "SO2" },{ value: 50, name: "PM2.5" },{ value: 80, name: "PM10" },{ value: 60, name: "NO2" },{ value: 106, name: "O3" },{ value: 90, name: "CO" },],},],},options2: {tooltip: {trigger: "axis",},legend: {data: ["PM2.5", "PM10", "SO2", "NO2", "O3"],},grid: {left: "3%",right: "4%",bottom: "3%",containLabel: true,},toolbox: {feature: {saveAsImage: {},},},xAxis: {type: "category",boundaryGap: false,data: ["1月", "3月", "5月", "7月", "9月", "11月"],},yAxis: {type: "value",},series: [{name: "PM2.5",type: "line",data: [41, 60, 43, 46, 70, 50],smooth: true,},{name: "PM10",type: "line",data: [71, 78, 90, 70, 76, 80],smooth: true,},{name: "SO2",type: "line",data: [15, 23, 20, 15, 19, 10],smooth: true,},{name: "NO2",type: "line",data: [103, 90, 60, 70, 40, 35],smooth: true,},{name: "O3",type: "line",data: [60, 70, 85, 105, 120, 80],smooth: true,},],},};},
};
</script><style scoped>
.content {width: 30%;
}
.head {padding: 10px;height: 80px;display: flex;justify-content: space-around;
}
.head_content {display: flex;flex-direction: column;justify-content: space-between;align-items: center;
}
.body {margin-top: 10px;
}
.body_table1 {display: flex;
}
</style>
效果:

中间代码
模板(<template>)部分:
- 整体被一个具有
content类的div包裹。- 第一个
div内包含一个自定义的dv-border-box-8组件,其内部的head部分有三个head_content类的div,分别展示了温度、湿度和噪声的数据及单位。 - 第二个
div具有body类,包含两个主要部分。- 第一个部分是一个自定义的
dv-border-box-6组件,用于展示温度监测的图表。 - 第二个部分是
body_table1类的div,其中又包含两个子div。- 第一个子
div包含一个自定义的dv-border-box-2组件,展示噪音监测的相关内容。 - 第二个子
div包含一个自定义的dv-border-box-2组件,展示湿度的相关图表。
- 第一个子
- 第一个部分是一个自定义的
- 第一个
脚本(<script>)部分:
- 引入了
Echart组件和echarts库。 - 定义了默认导出对象。
components中注册了Echart组件。data函数返回了多个数据对象:options1用于配置 24 小时温度监测的折线图。airData(似乎未被实际使用)。noiseData用于噪音监测的数据。options2用于配置湿度监测的仪表盘图表。
样式(<style scoped>)部分:
content类的div宽度设置为 38% 。head类的div有内边距、高度,并使用flex布局实现元素之间的等间距排列。head_content类的div使用纵向的flex布局,并调整内部元素的垂直和水平对齐方式。body类的div有上边距。body_table1类的div使用flex布局。
<template><div class="content"><div><dv-border-box-8 :reverse="true"><div class="head"><div class="head_content"><h1>25</h1><h2>温度(℃)</h2></div><div class="head_content"><h1>40</h1><h2>湿度(%rh)</h2></div><div class="head_content"><h1>65</h1><h2>噪声(dB)</h2></div></div></dv-border-box-8></div><div class="body"><!-- 温度监测表 --><dv-border-box-6><Echart :options="options1" height="400px"/></dv-border-box-6><!-- 城市噪音监测表与城市湿度 --><div class="body_table1"><div><dv-border-box-2 style="padding: 10px"><h2>噪音监测</h2><dv-capsule-chart:config="noiseData"style="width: 370px; height: 380px"/></dv-border-box-2></div><div><dv-border-box-2 style="padding: 10px"><h2>湿度</h2><Echart :options="options2" height="380px" width="300px" /></dv-border-box-2></div></div></div></div>
</template><script>
import Echart from "@/common/echart/index.vue";
import * as echarts from "echarts";
export default {components: { Echart },data() {return {options1: {color: ["#005fa2"],title: {text: "24小时温度监测",},tooltip: {trigger: "axis",axisPointer: {type: "cross",label: {backgroundColor: "#6a7985",},},},legend: {data: ["air spend"],},toolbox: {feature: {saveAsImage: {},},},grid: {left: "3%",right: "4%",bottom: "3%",containLabel: true,},xAxis: [{name: "h",type: "category",boundaryGap: false,data: [0, 2, 4, 6, 8, 10, 12, 14, 16, 18, 20, 22],},],yAxis: [{name: "摄氏度",type: "value",},],series: [{type: "line",stack: "Total",smooth: true,lineStyle: {width: 0,},showSymbol: false,areaStyle: {opacity: 0.8,color: new echarts.graphic.LinearGradient(0, 0, 0, 1, [{offset: 0,color: "rgb(35, 67, 234)",},{offset: 1,color: "rgb(121, 185, 235)",},]),},emphasis: {focus: "series",},data: [14, 14, 14, 14, 18, 20, 21, 20, 19, 18, 16, 15],},],},airData: {header: ["城市", "首要污染物", "等级", "AQI"],data: [["平桥区区", "——", "优", 34],["浉河区区", "——", "优", 31],["罗山县", "O3", "轻度污染", 94],["息县", "PM2.5", "良", 52],["光山县", "——", "优", 34],["新县", "——", "优", 31],["潢川县", "O3", "轻度污染", 94],["商城县", "PM2.5", "良", 52],["淮滨县", "——", "优", 31],["固始县", "O3", "轻度污染", 94]],},noiseData: {data: [{name: "平桥区",value: 167,},{name: "浉河区",value: 67,},{name: "罗山县",value: 123,},{name: "光山县",value: 55,},{name: "息县",value: 98,},{name: "新县",value: 57,},{name: "潢川县",value: 98,},{name: "商城县",value: 57,},{name: "固始县",value: 98,},{name: "淮滨县",value: 57,},],},options2: {tooltip: {formatter: "{a} <br/>{b} : {c}%",},series: [{name: "Pressure",type: "gauge",detail: {formatter: "{value}",},data: [{value: 50,name: "%rh",},],},],},};},
};
</script><style scoped>
.content {width: 38%;
}
.head {padding: 10px;height: 80px;display: flex;justify-content: space-around;
}
.head_content {display: flex;flex-direction: column;justify-content: space-between;align-items: center;
}
.body {margin-top: 10px;
}
.body_table1 {display: flex;
}
</style>
效果: