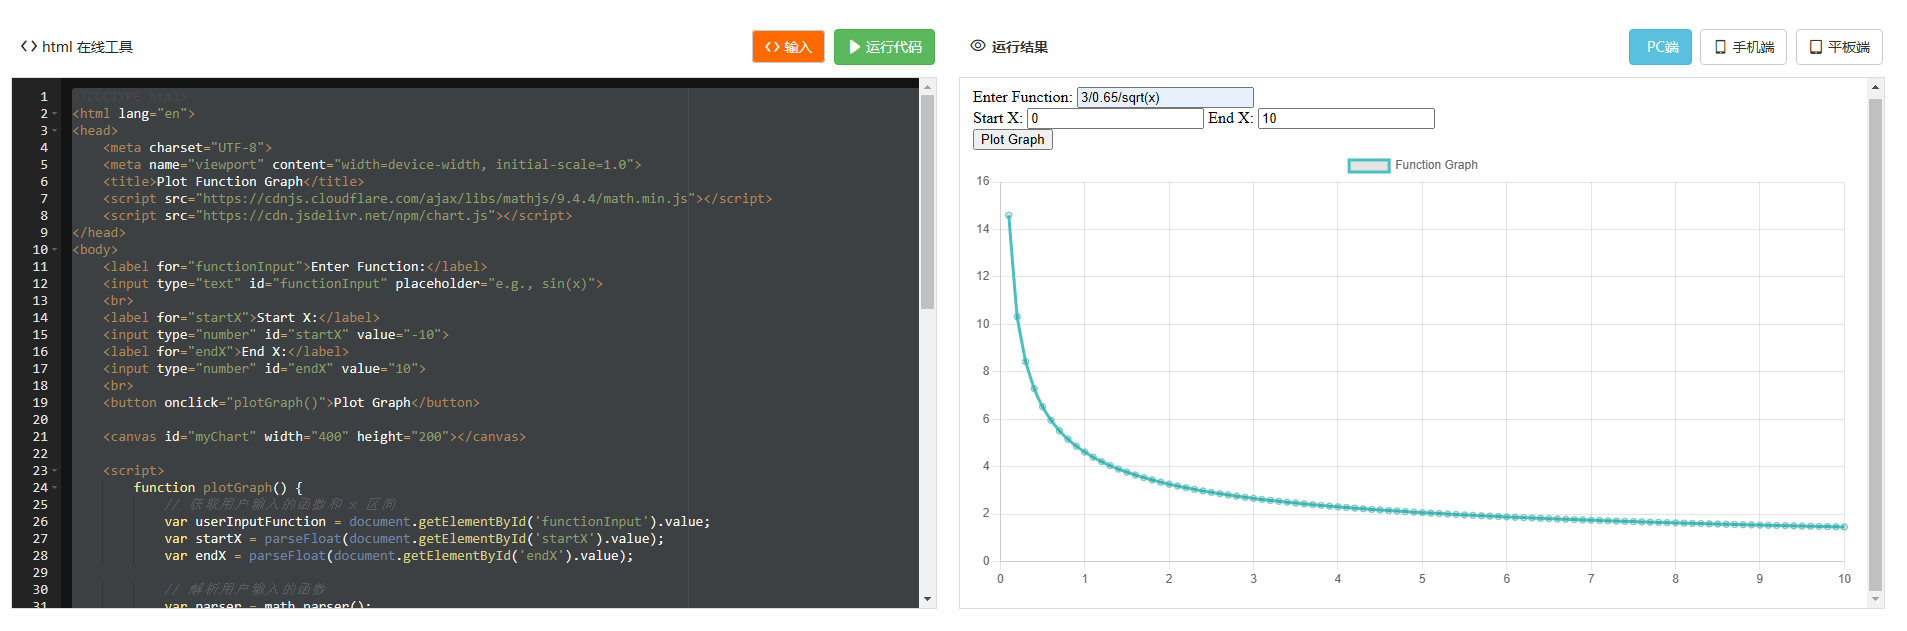
大概效果如下:
可以自定义函数和x的定义域。
我们可以使用数学表达式解析库来解析用户输入的函数方程,并根据给定的 x 区间计算函数的值,然后使用图表库绘制图形。
在这里,我将使用 math.js 库来解析数学表达式,并使用 Chart.js 库来绘制图形。首先,确保你的页面中包含了这两个库:
<!DOCTYPE html>
<html lang="en">
<head><meta charset="UTF-8"><meta name="viewport" content="width=device-width, initial-scale=1.0"><title>Plot Function Graph</title><script src="https://cdnjs.cloudflare.com/ajax/libs/mathjs/9.4.4/math.min.js"></script><script src="https://cdn.jsdelivr.net/npm/chart.js"></script>
</head>
<body><label for="functionInput">Enter Function:</label><input type="text" id="functionInput" placeholder="e.g., sin(x)"><br><label for="startX">Start X:</label><input type="number" id="startX" value="-10"><label for="endX">End X:</label><input type="number" id="endX" value="10"><br><button onclick="plotGraph()">Plot Graph</button><canvas id="myChart" width="400" height="200"></canvas><script>function plotGraph() {// 获取用户输入的函数和 x 区间var userInputFunction = document.getElementById('functionInput').value;var startX = parseFloat(document.getElementById('startX').value);var endX = parseFloat(document.getElementById('endX').value);// 解析用户输入的函数var parser = math.parser();parser.evaluate('f(x) = ' + userInputFunction);// 计算函数值var data = [];for (var x = startX; x <= endX; x += 0.1) {var y = parser.evaluate('f(' + x + ')');data.push({x: x, y: y});}// 绘制图表var ctx = document.getElementById('myChart').getContext('2d');var myChart = new Chart(ctx, {type: 'line',data: {datasets: [{label: 'Function Graph',data: data,fill: false,borderColor: 'rgb(75, 192, 192)',tension: 0.1}]},options: {scales: {x: {type: 'linear',position: 'bottom'},y: {beginAtZero: true}}}});}</script>
</body>
</html>