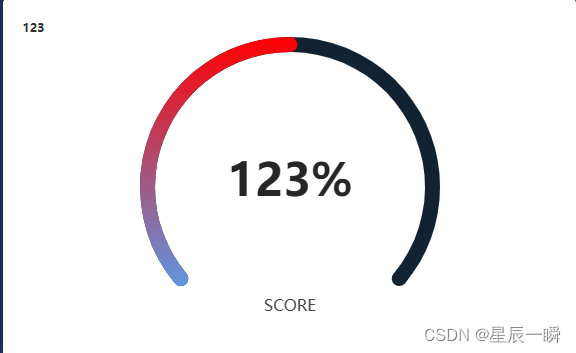
有模拟数据可以直接使用
const options = { animation : true , title : { top : "35%" , left : "center" , itemGap : 15 , textStyle : { color : "#666666" , fontSize : 16 , fontWeight : 400 , fontFamily : "HYXJ" , } , subtext : '123' + "%" , subtextStyle : { color : "#262626" , fontSize : 45 , fontWeight : "bold" , fontFamily : "HYXJ" , } , } , series : [ { type : "gauge" , startAngle : 220 , endAngle : 320 , min : 0 , max : 100 , radius : "100%" , center : [ "50%" , "50%" ] , progress : { roundCap : "true" , show : true , width : 15 , itemStyle : { color : { type : "linear" , x : 0 , y : 0 , x2 : 0 , y2 : 1 , colorStops : [ { offset : 0 , color : "red" , } , { offset : 1 , color : "rgba(96, 150, 224, 1)" , } , ] , } , } , } , axisLine : { roundCap : "true" , lineStyle : { width : 15 , color : [ [ 1 , "#123" ] , ] , } , } , pointer : { show : false } , axisTick : { show : false } , splitLine : { show : false } , axisLabel : { show : false } , detail : { show : false } , data : [ { value : 50 , name : 'SCORE' , title : { offsetCenter : [ '0%' , '80%' ] } , } ] } ]
} ;


![[MRCTF2020]Ez_bypass1 and [网鼎杯 2020 青龙组]AreUSerialz1()php语言基础学习,以及序列化概念的基本了解](https://img-blog.csdnimg.cn/direct/81278ff8a9ce4588bb249b1696b83133.png)