前言
一个Java应用 可以不优秀,但是一定不能没有监控方案。否则极大影响排查线上问题的效 以及系统故障的及时告警 。试想 核心应用挂了一个 但是没有配置告警 理想情况几个小时 被自己人发现了 但是万一自己人也没看到或者没关注 那难道让服务一直挂下去么 ?
客户:**服务
1.简介
目前市面上监控有很多种 在这里我们选用的是Promethus
2.Promethus 介绍
Prometheus是一个开源的系统监控和警报工具包,最初由SoundCloud构建。自2012年成立以来,许多公司和组织都采用了Prometheus,该项目拥有非常活跃的开发人员和用户社区。它现在是一个独立的开源项目,独立于任何公司进行维护。为了强调这一点,并澄清项目的治理结构,Prometheus于2016年加入了云原生计算基金会,成为Kubernetes之后的第二个托管项目。
普罗米修斯收集和存储它的指标作为时间序列数据,也就是说,指标信息与它被记录的时间戳一起存储,以及称为标签的可选键值对。
3. Promethus特性
普罗米修斯的主要特点是:
- 一个多维数据模型,其时间序列数据由度量名称和键/值对标识
- PromQL是一种灵活的查询语言,可以利用这个维度
- 不依赖分布式存储;单个服务器节点是自治的
- 时间序列收集通过HTTP上的拉模型进行
- 通过中间网关支持推送时间序列
- 目标是通过服务发现或静态配置发现的
- 支持多种模式的图形化和仪表板
4. Promethus组件
Prometheus生态包括了很多组件,它们中的一些是可选的:
- Prometheus主服务器,用于抓取和存储时间序列数据
- 用于检测应用程序代码的客户端库
- 用于支持短声明周期的push网关
- 针对HAProxy,StatsD,Graphite等服务的特定exporters
- 警告管理器
- 各种支持工具
多数Prometheus组件是Go语言写的,这使得这些组件很容易编译和部署。
5. Promethus架构
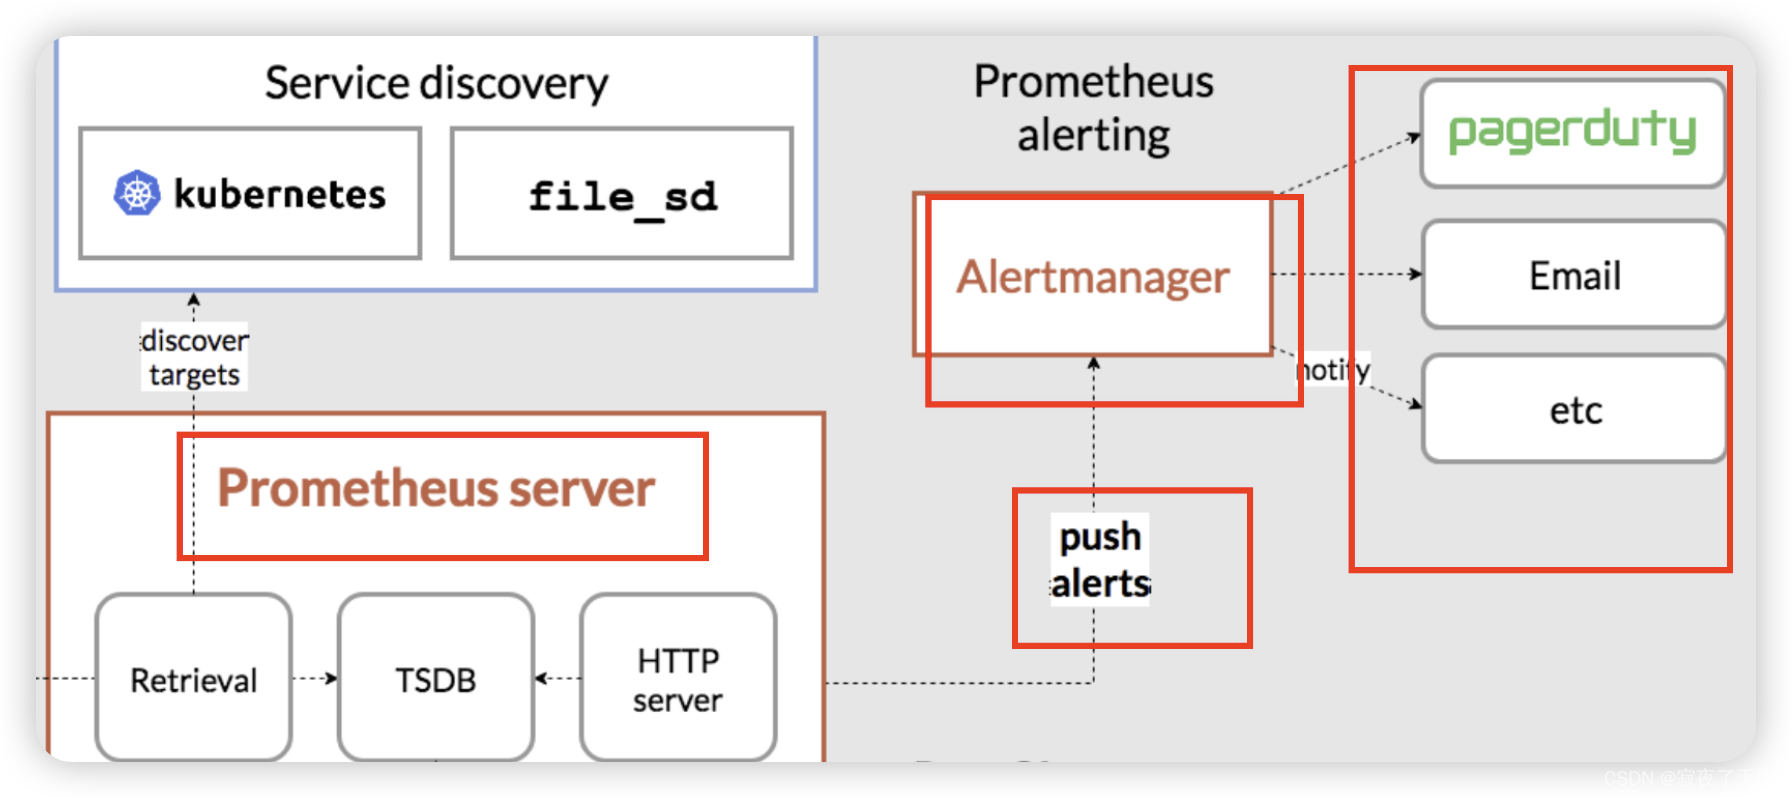
下面这张图说明了Prometheus的整体架构,以及生态中的一些组件作用:
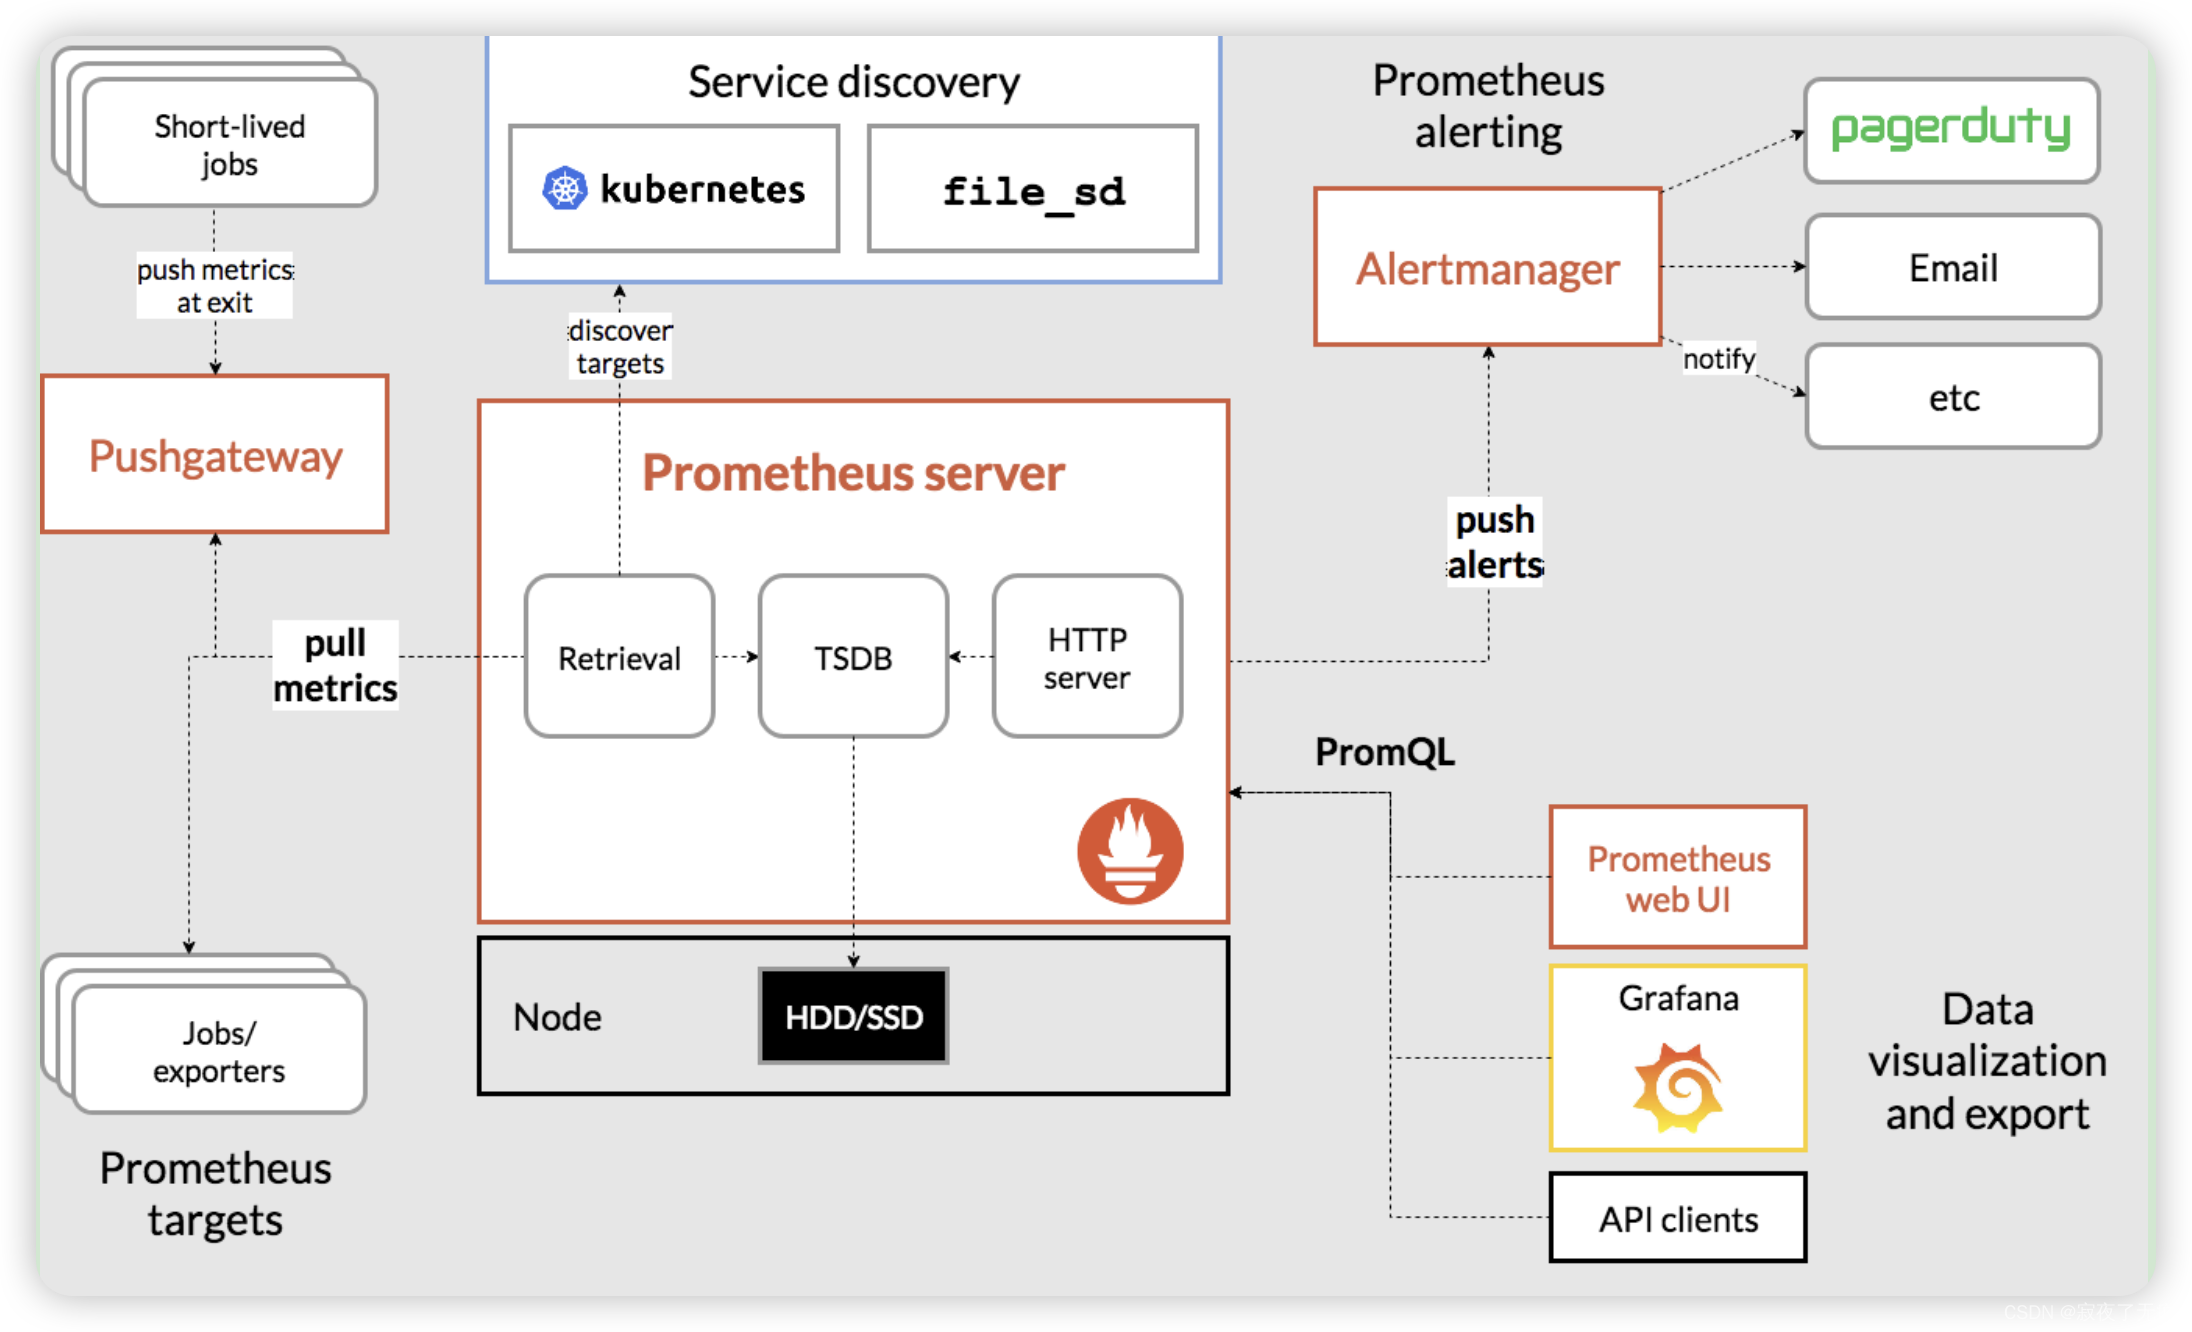
建议这个图 反复多看几遍 这样后边会有个整理的了解
6. Promethus适用性
普罗米修斯可以很好地记录任何纯数字时间序列。它既适合于以机器为中心的监视,也适合于高度动态的面向服务的体系结构的监视。在微服务的世界里,它对多维数据收集和查询的支持是一个特别的优势。
Prometheus是为可靠性而设计的,它是您在停机期间使用的系统,允许您快速诊断问题。每个Prometheus服务器都是独立的,不依赖于网络存储或其他远程服务。当基础设施的其他部分损坏时,您可以依赖它,并且不需要设置广泛的基础设施来使用它。
7. 环境搭建
- 下载并解压 https://prometheus.io/download/
- 配置 (详情见https://prometheus.io/docs/prometheus/latest/configuration/configuration/ 无特殊情况,首次配置 直接使用默认的进行修改即可)
Prometheus配置是YAML。 示例配置如下
global:scrape_interval: 15sevaluation_interval: 15srule_files:# - "first.rules"# - "second.rules"scrape_configs:- job_name: prometheusstatic_configs:- targets: ['localhost:9090']
全局块控制Prometheus服务器的全局配置。 我们有两种选择。 第一个是scrape_interval,它控制Prometheus抓取目标的频率。 您可以为单个目标重写此值。 在这种例子下,全局设置是每15s抓取一次。 evaluation_interval选项控制Prometheus评估规则的频率。 Prometheus使用规则创建新的时间序列并生成警报。
rule_files块指定我们希望Prometheus服务器加载的任何规则的位置。 现在我们没有规则。
最后一个块scrape_configs控制Prometheus监视的资源。 由于Prometheus还将自己的数据公开为HTTP端点,因此它可以抓取并监控自身的健康状况。 在默认配置中,有一个名为prometheus的作业,它会抓取Prometheus服务器公开的时间序列数据。 该作业包含一个静态配置的目标,即端口9090上的localhost。Prometheus希望指标在/metrics路径上的目标上可用。 所以这个默认的工作是通过URL抓取:http//localhost:9090/metrics。
返回的时间序列数据将详细说明Prometheus服务器的状态和性能。
- 启动Prometheus使用刚才的配置文件 启动
./prometheus --config.file=prometheus.yml
8. Prometheus其他操作
- 使用表达式浏览器
让我们试着看一下Prometheus收集的关于自己的一些数据。 要使用Prometheus的内置表达式浏览器,请导航到http://localhost:9090/graph
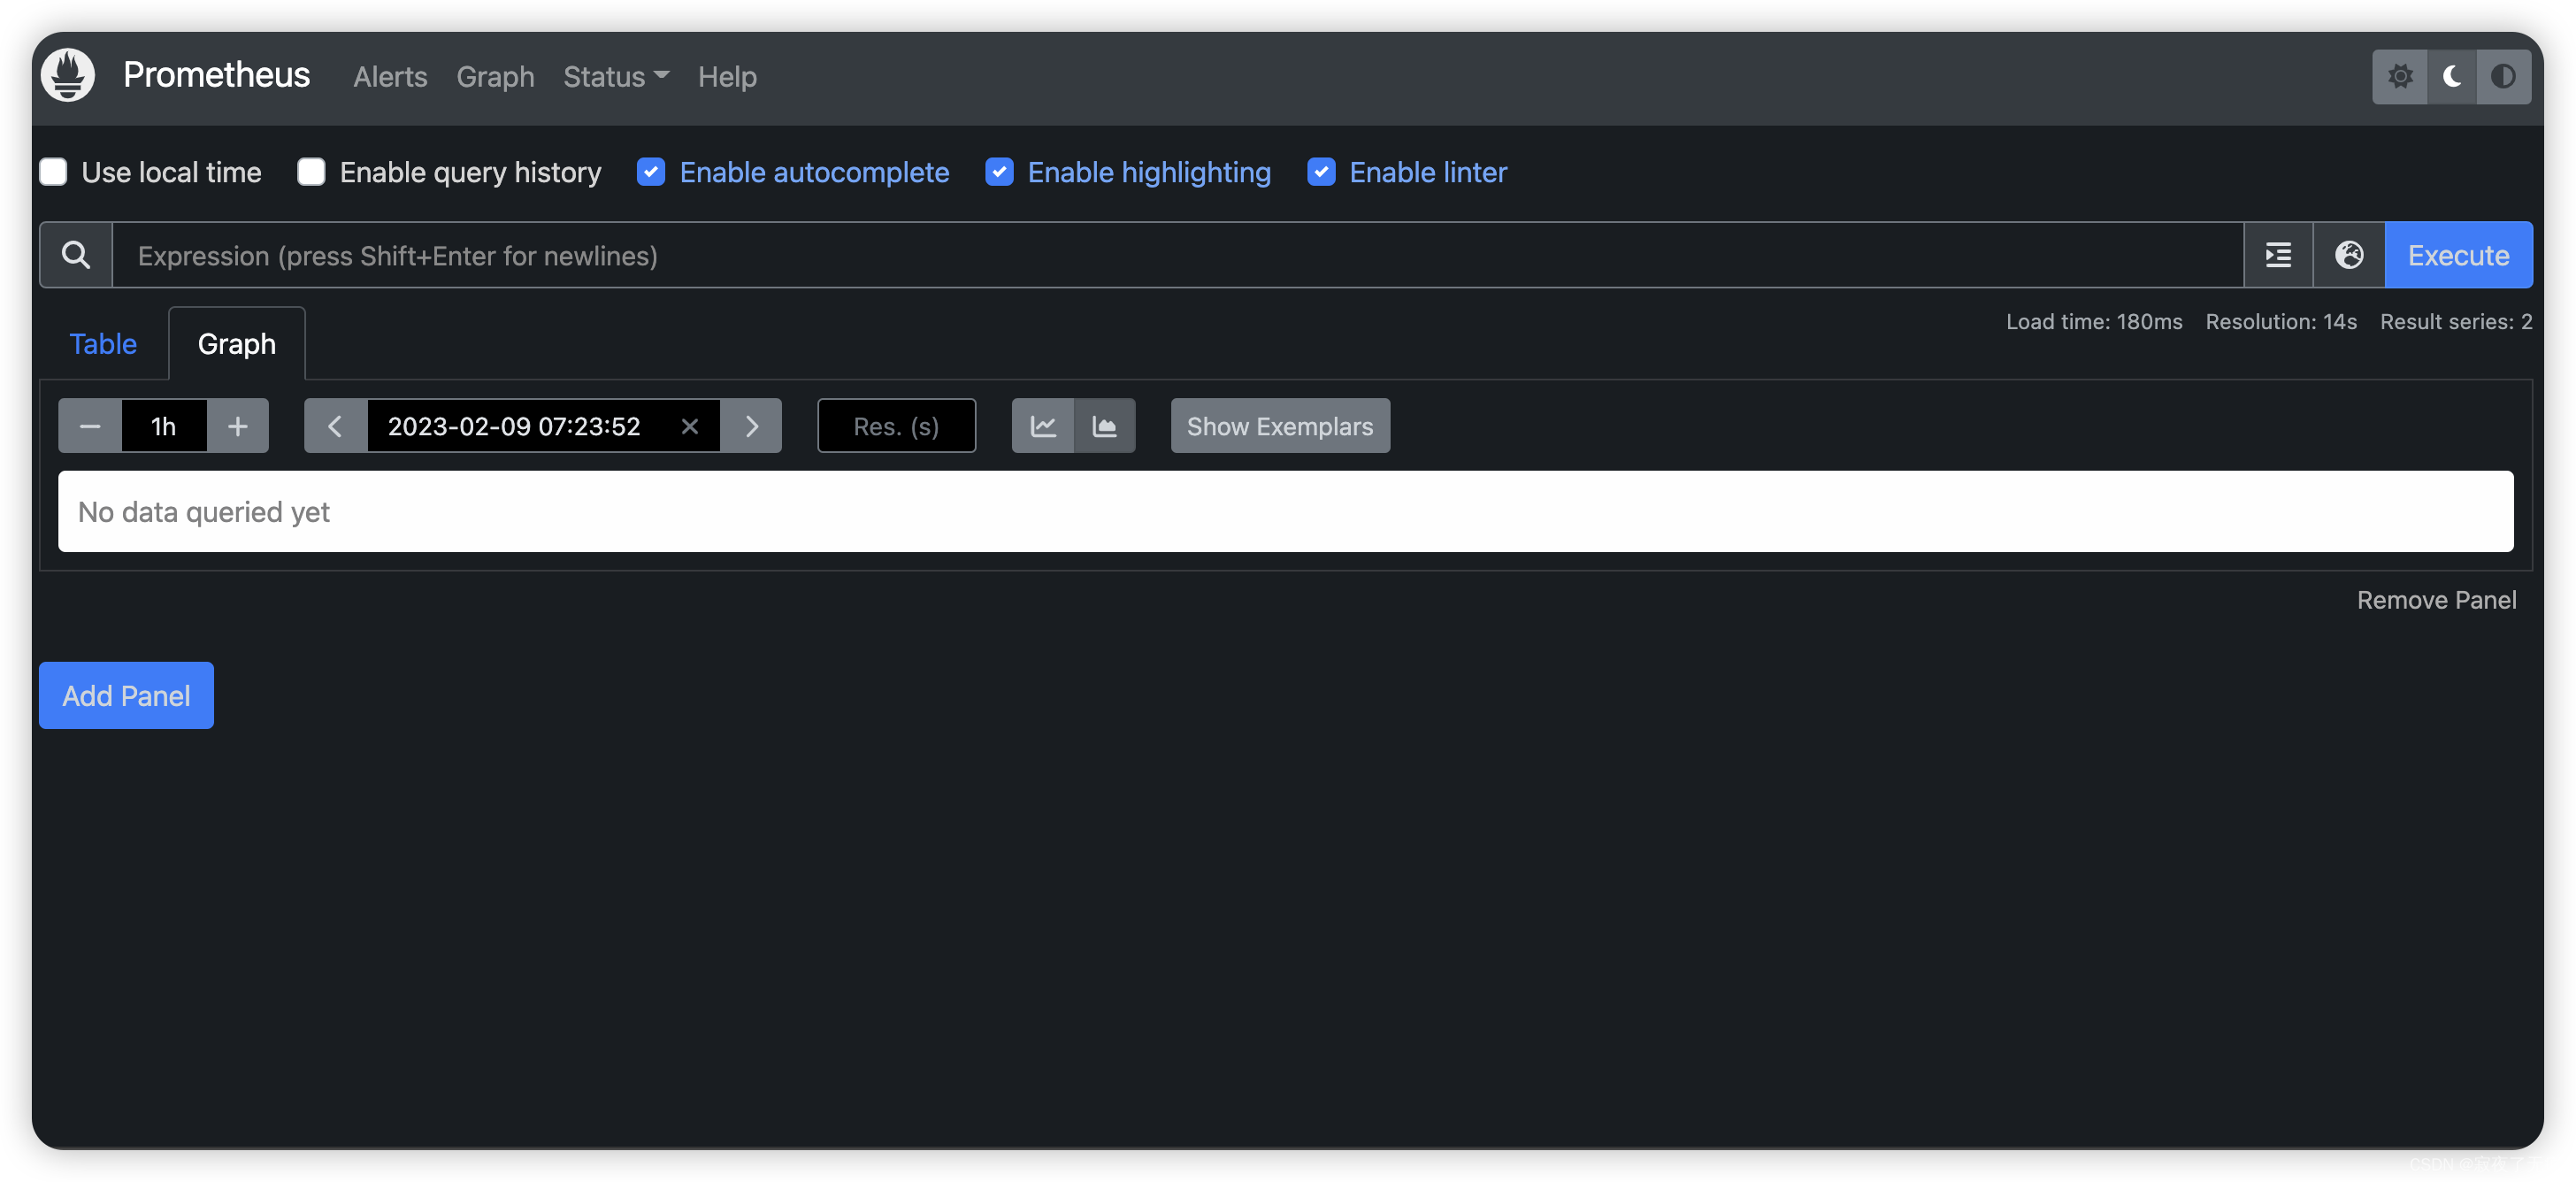
正如您可以从http://localhost:9090/metrics收集的那样,Prometheus导出的一个度量标准称为promhttp_metric_handler_requests_total(Prometheus服务器已服务的/ metrics请求的总数)。
继续并将其输入表达式输入框 并点击执行 :
promhttp_metric_handler_requests_total
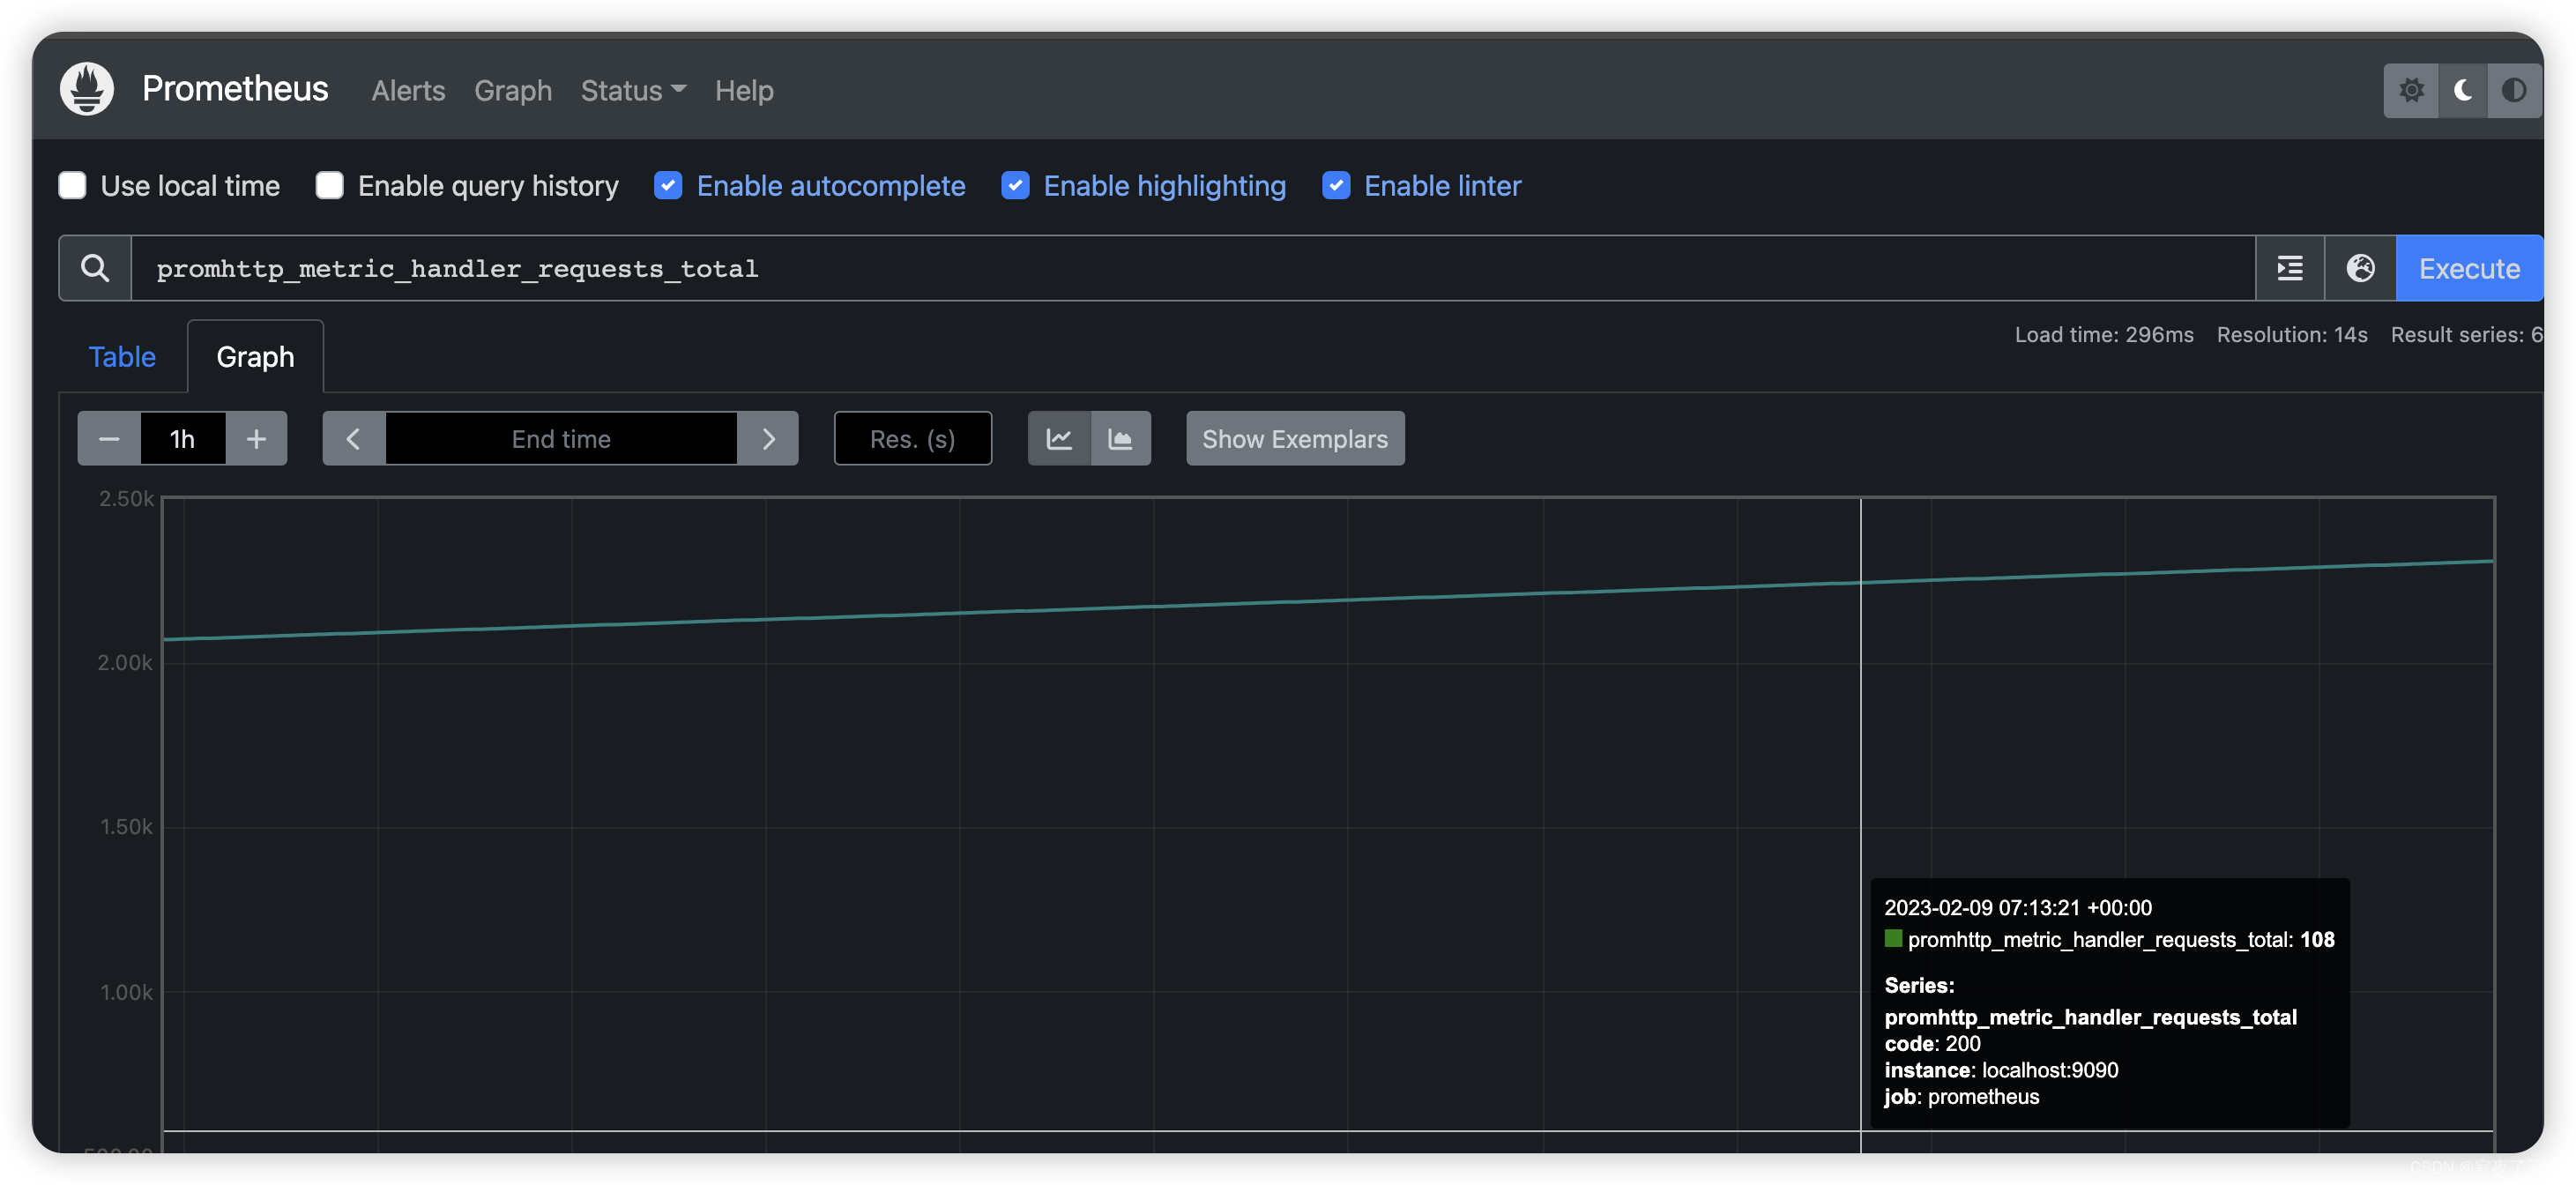
这应该返回许多不同的时间序列(以及为每个记录的最新值),所有时间序列都使用度量标准名称promhttp_metric_handler_requests_total,但具有不同的标签。 这些标签指定不同的请求状态。
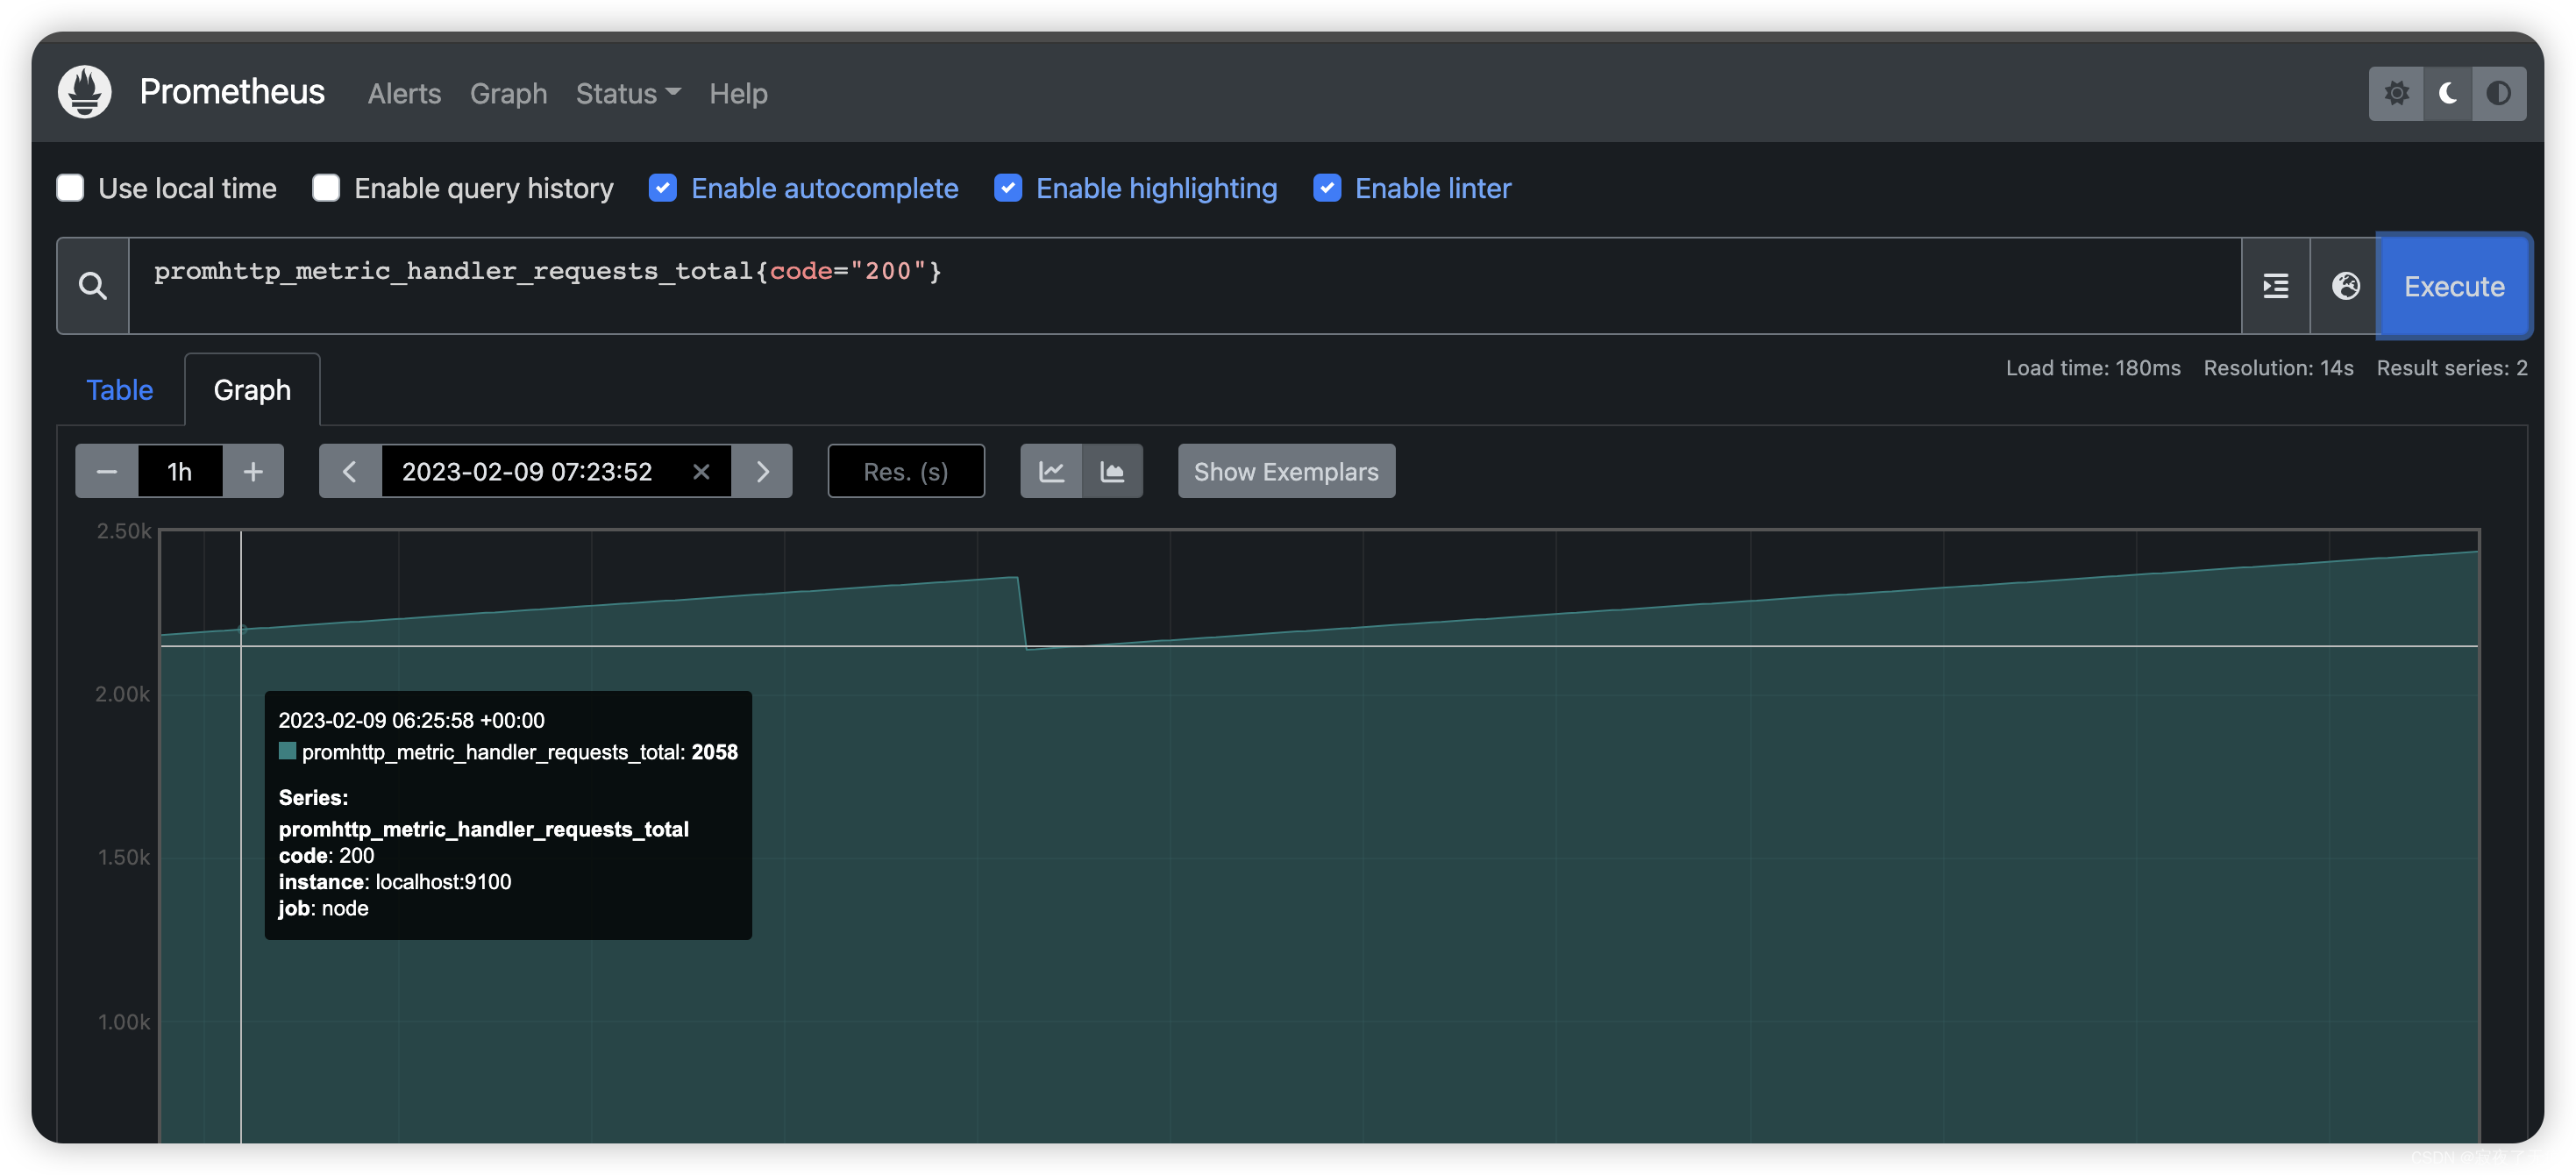
如果我们只对导致HTTP代码200的请求感兴趣,我们可以使用此查询来检索该信息:
promhttp_metric_handler_requests_total{code=“200”}
效果图如下
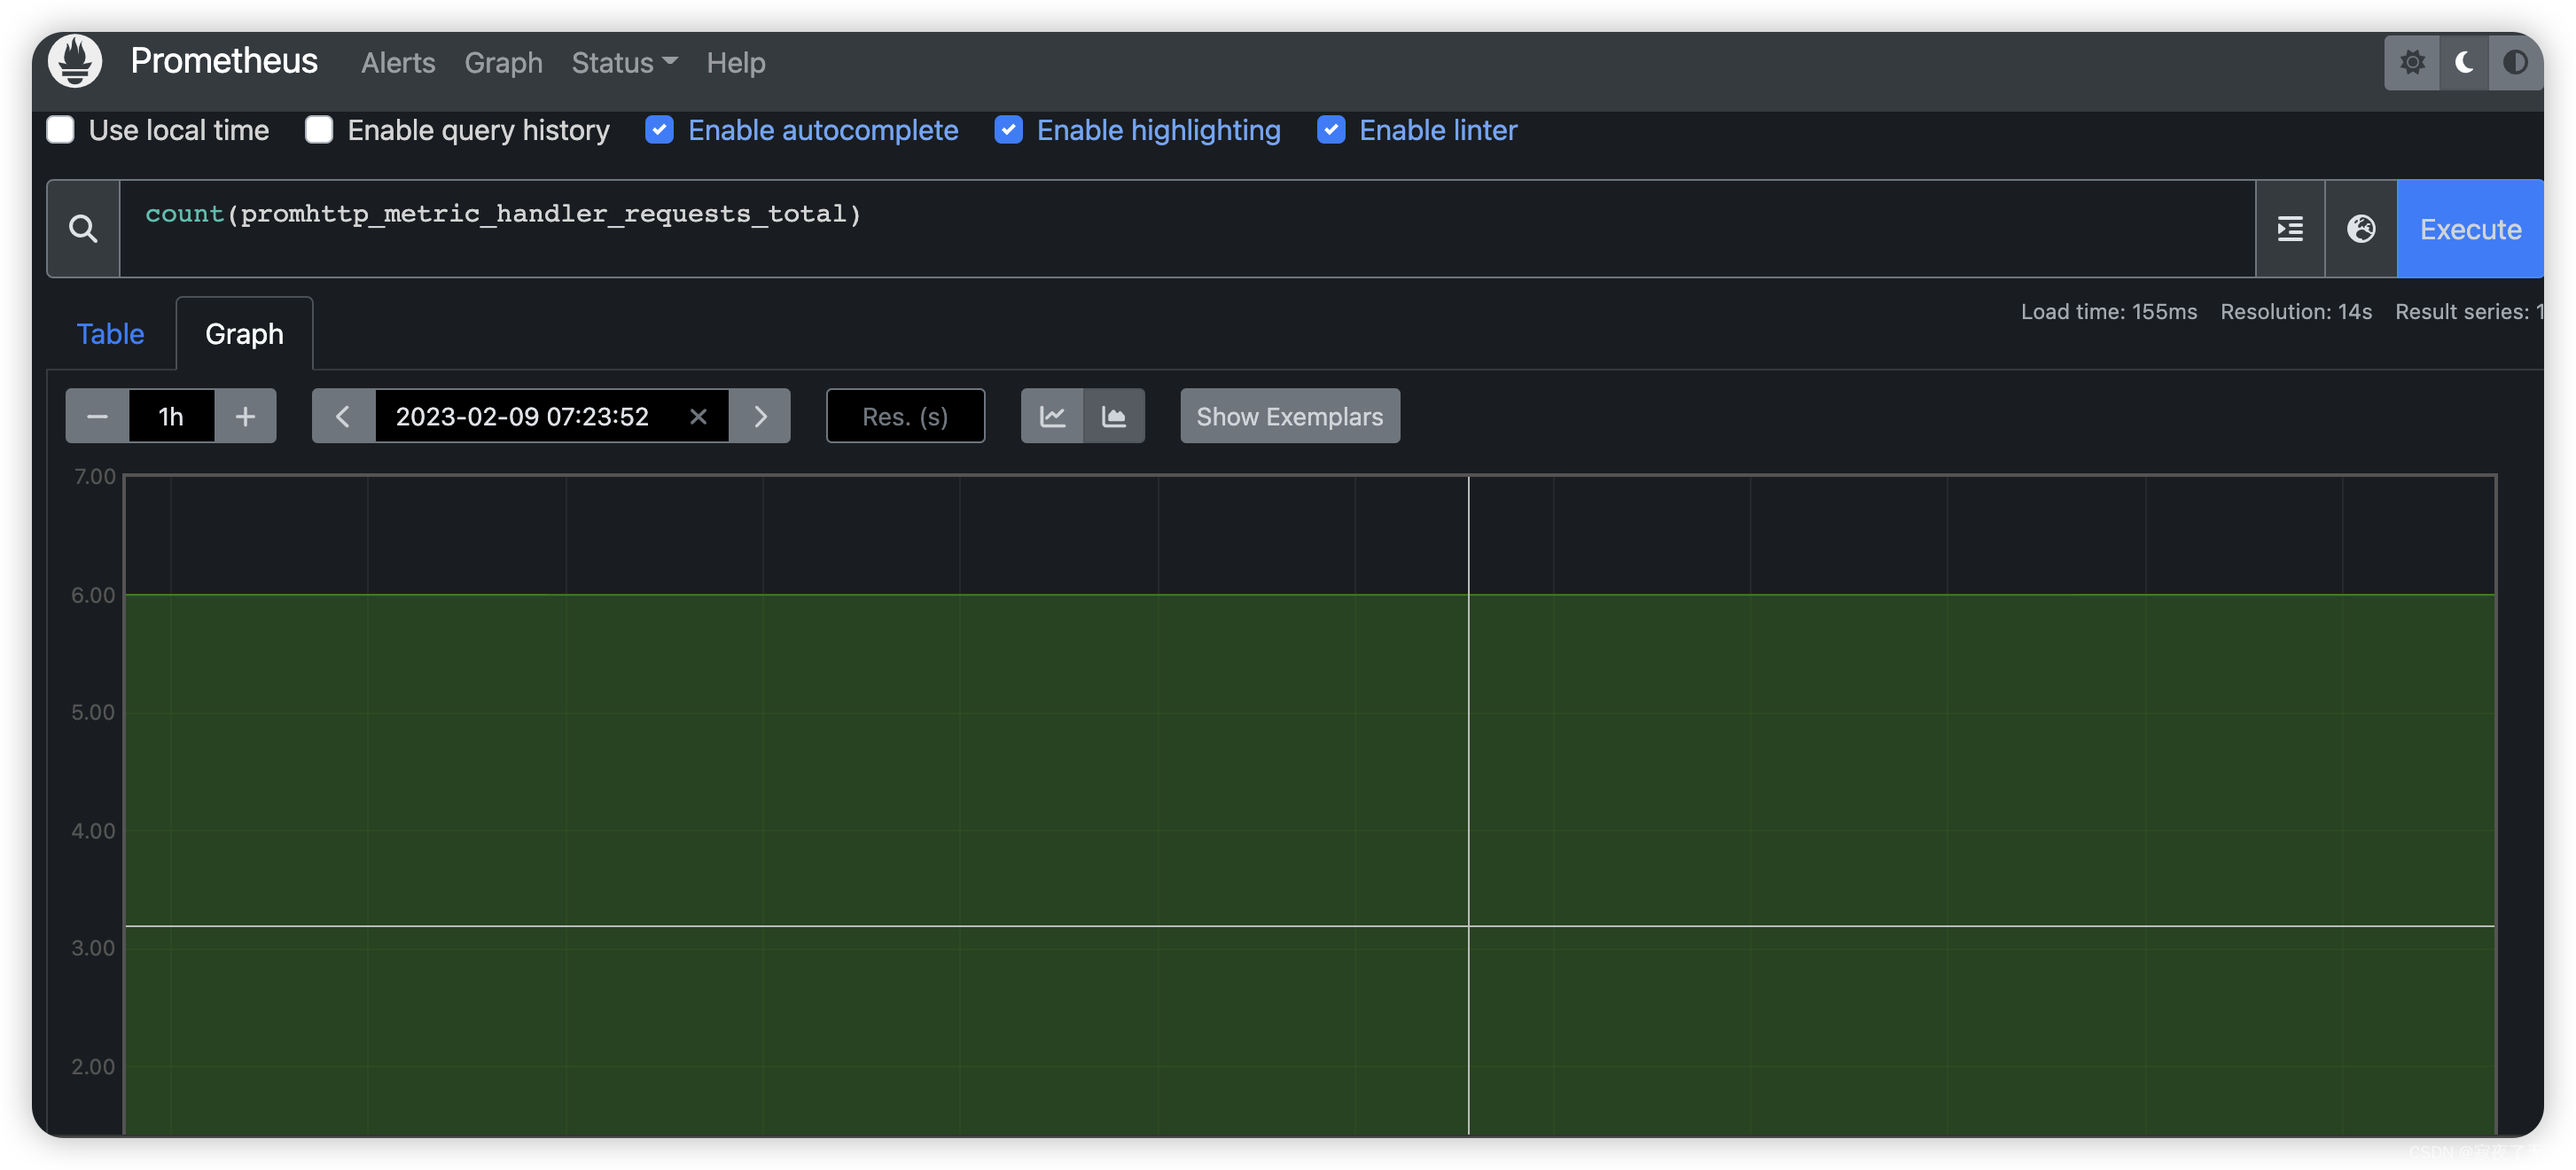
要计算返回的时间序列总数,您可以写:
count(promhttp_metric_handler_requests_total)
效果图如下
有关表达式语言的更多信息,请参阅表达式语言文档。
- 适用图表接口
要绘制表达式图表,请导航到http//localhost:9090/graph graph并使用“图表”选项卡。
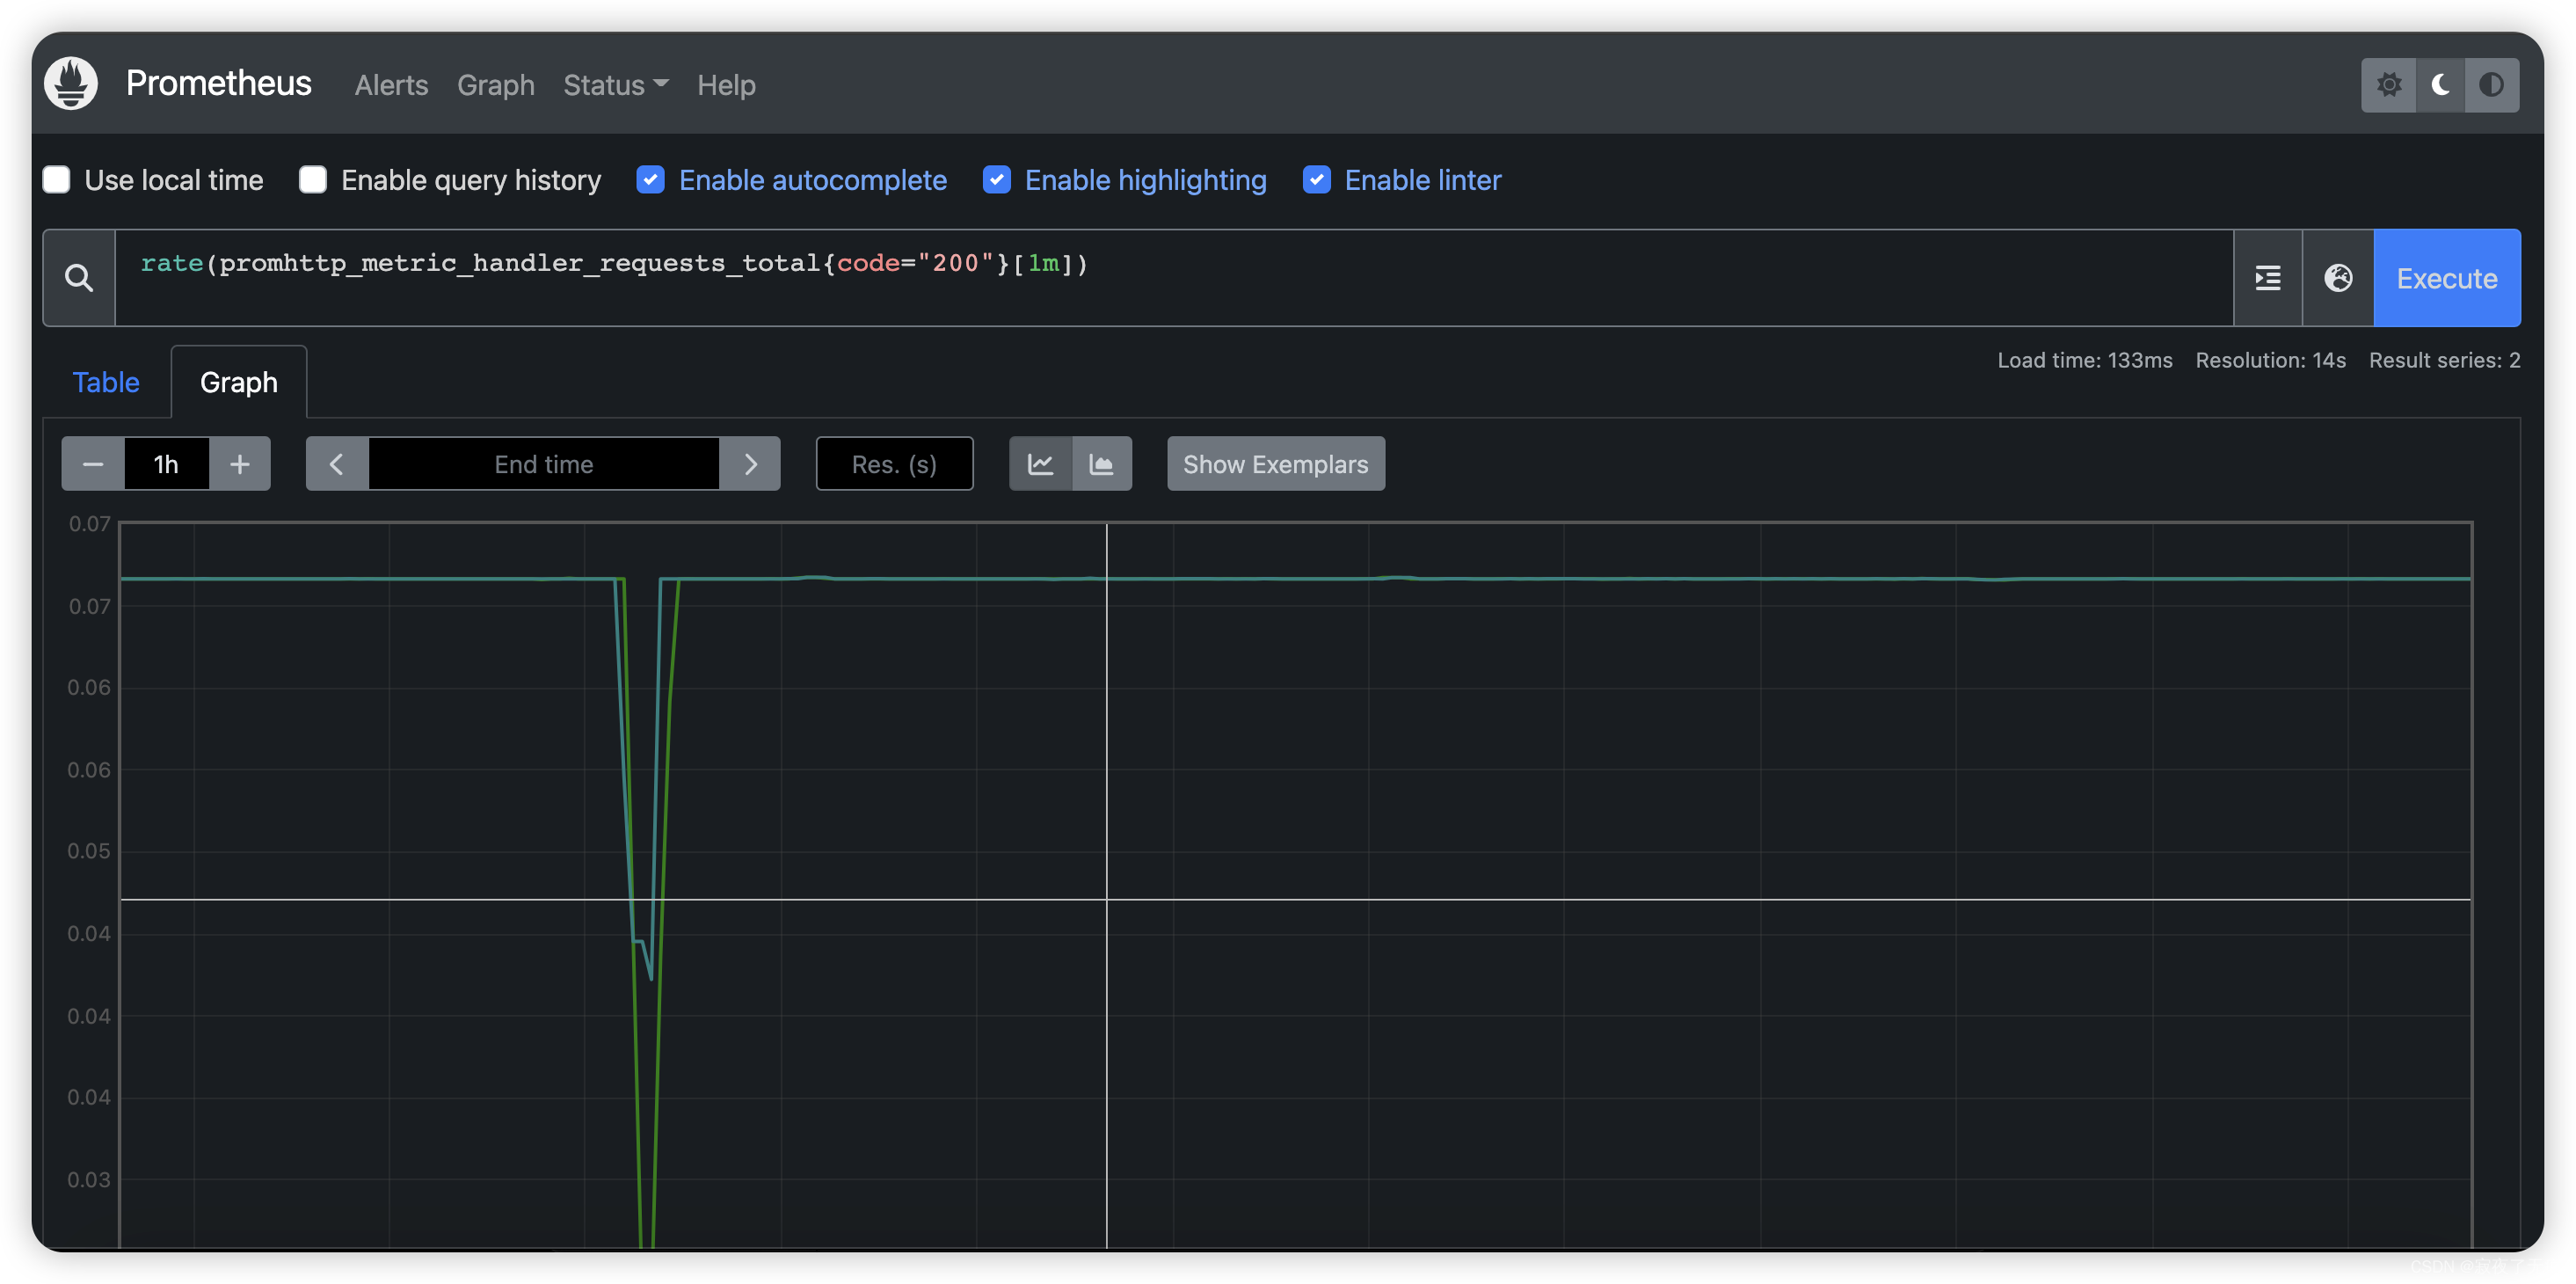
例如,输入以下表达式来绘制在自我抓取的Prometheus中发生的返回状态代码200的每秒HTTP请求率:
rate(promhttp_metric_handler_requests_total{code=“200”}[1m])
您可以尝试图形范围参数和其他设置。
- 监控其他目标
仅从Prometheus那里收集指标并不能很好地反映Prometheus的能力。 为了更好地了解Prometheus可以做什么,我们建议您浏览有关其他exporter的文档。 使用node exporter指南监控Linux或macOS主机指标是一个很好的起点。 另外也可以使用官方/第三方的 其他的 exporter https://prometheus.io/docs/instrumenting/exporters/
(Exporter)导出器
导出器是暴露Prometheus度量指标的二进制文件,通常将非Prometheus数据格式转化为Prometheus支持的数据处理格式
以为到这里就结束了么 no~~~
如上的图形化操作界面 怎么能满足我们的需求 不能每次搜索都得用自己手动搜吧 接下来是 图形化的界面 Grafana 介绍
9. 图形化界面 Grafana
9.1什么是Grafana?
Grafana允许您查询、可视化、提醒和理解您的指标,无论它们存储在哪里。创建、探索并与团队共享漂亮的仪表盘,培养数据驱动的文化。
9.2 环境搭建
- 下载 curl -O https://dl.grafana.com/oss/release/grafana-7.1.5.darwin-amd64.tar.gz
- 解压
- 启动 ./bin/grafana-server web
- 配置修改(可选 https://grafana.com/docs/grafana/latest/setup-grafana/configure-grafana/ )
9.3 首次配置
启动成功后 浏览器访问localhost:3000(默认端口 如果修改了 请替换)
打开首先会进入登录页面 让输入账号密码 admin/admin
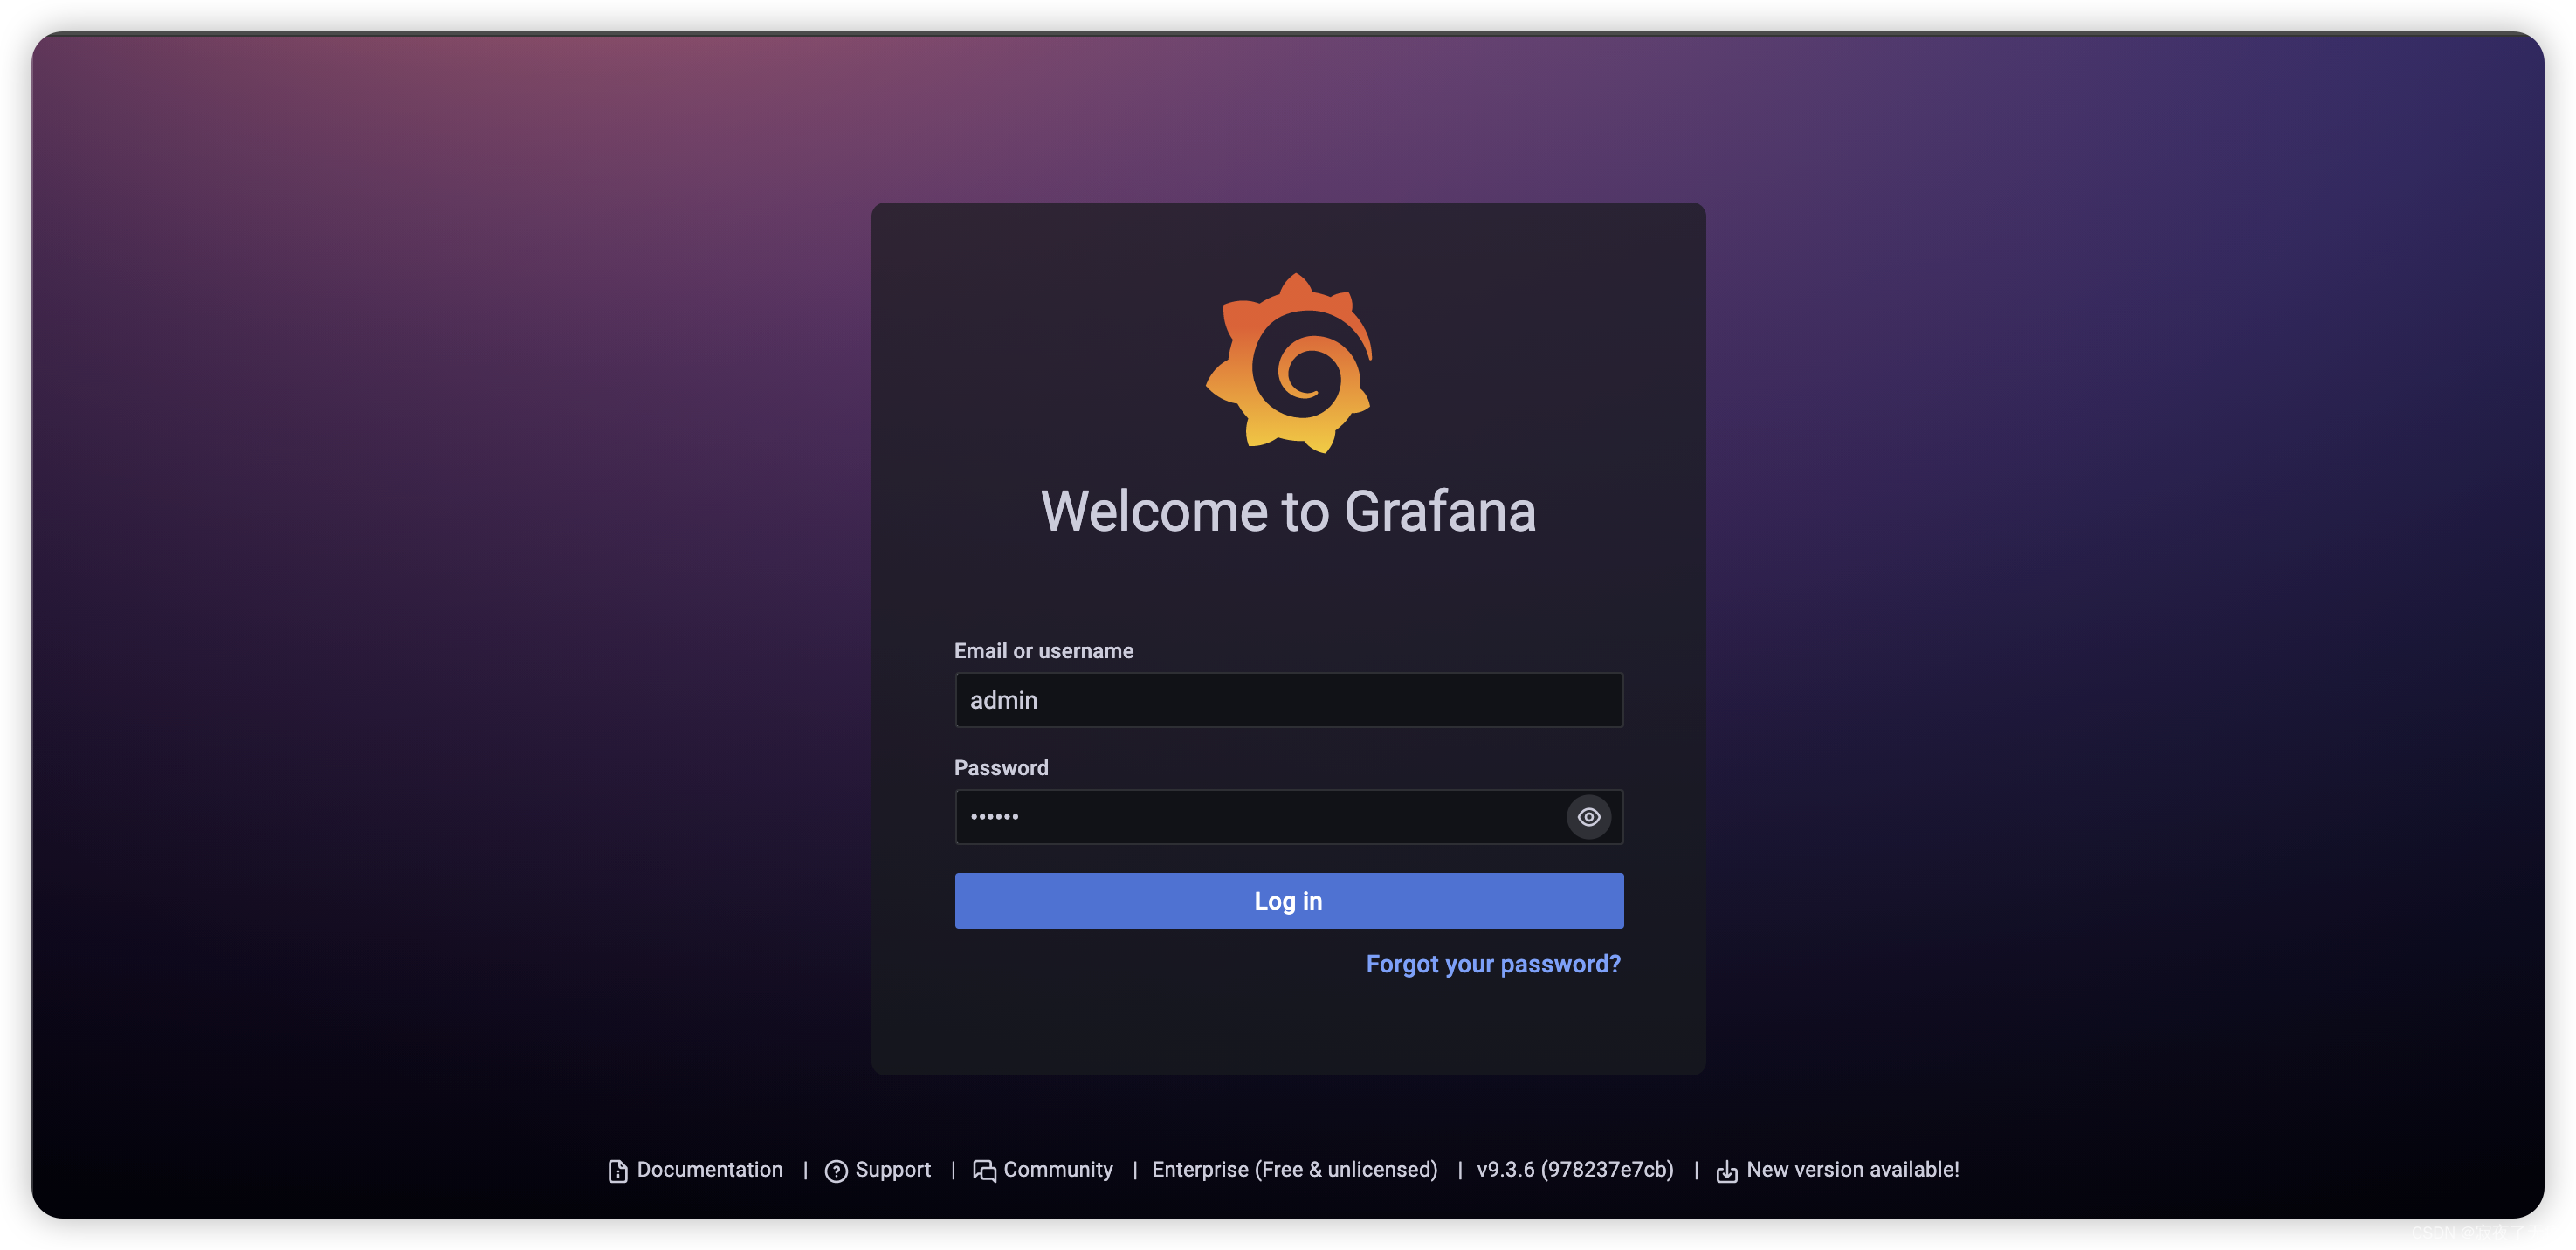
登录时 会让修改默认的密码 看自己选择
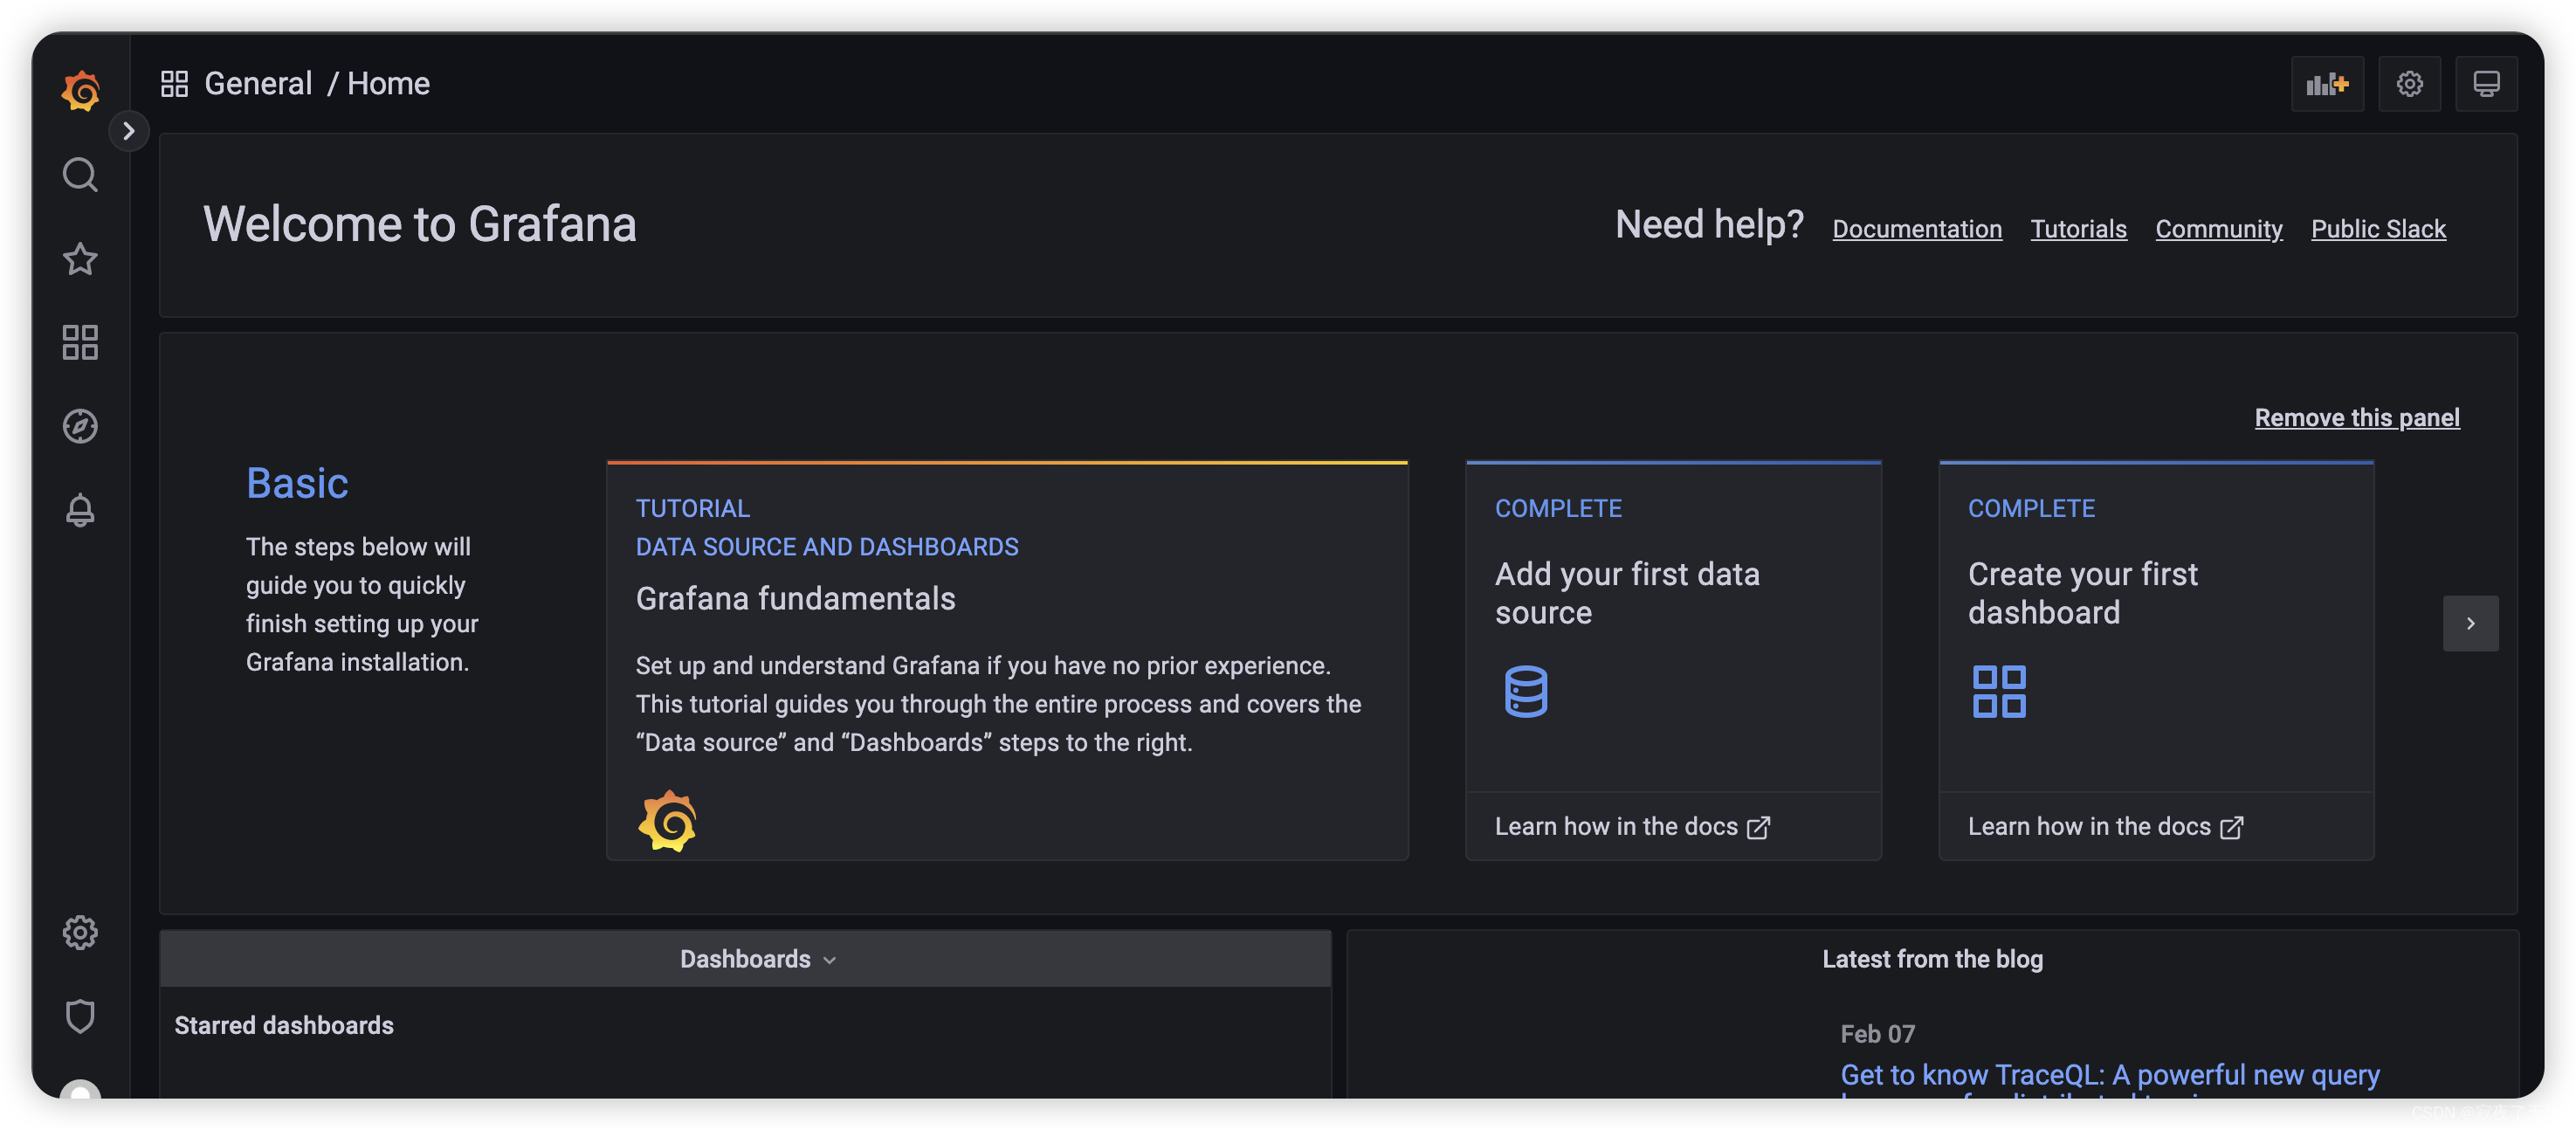
登录成功后 会进入首页
然后 选择 配置
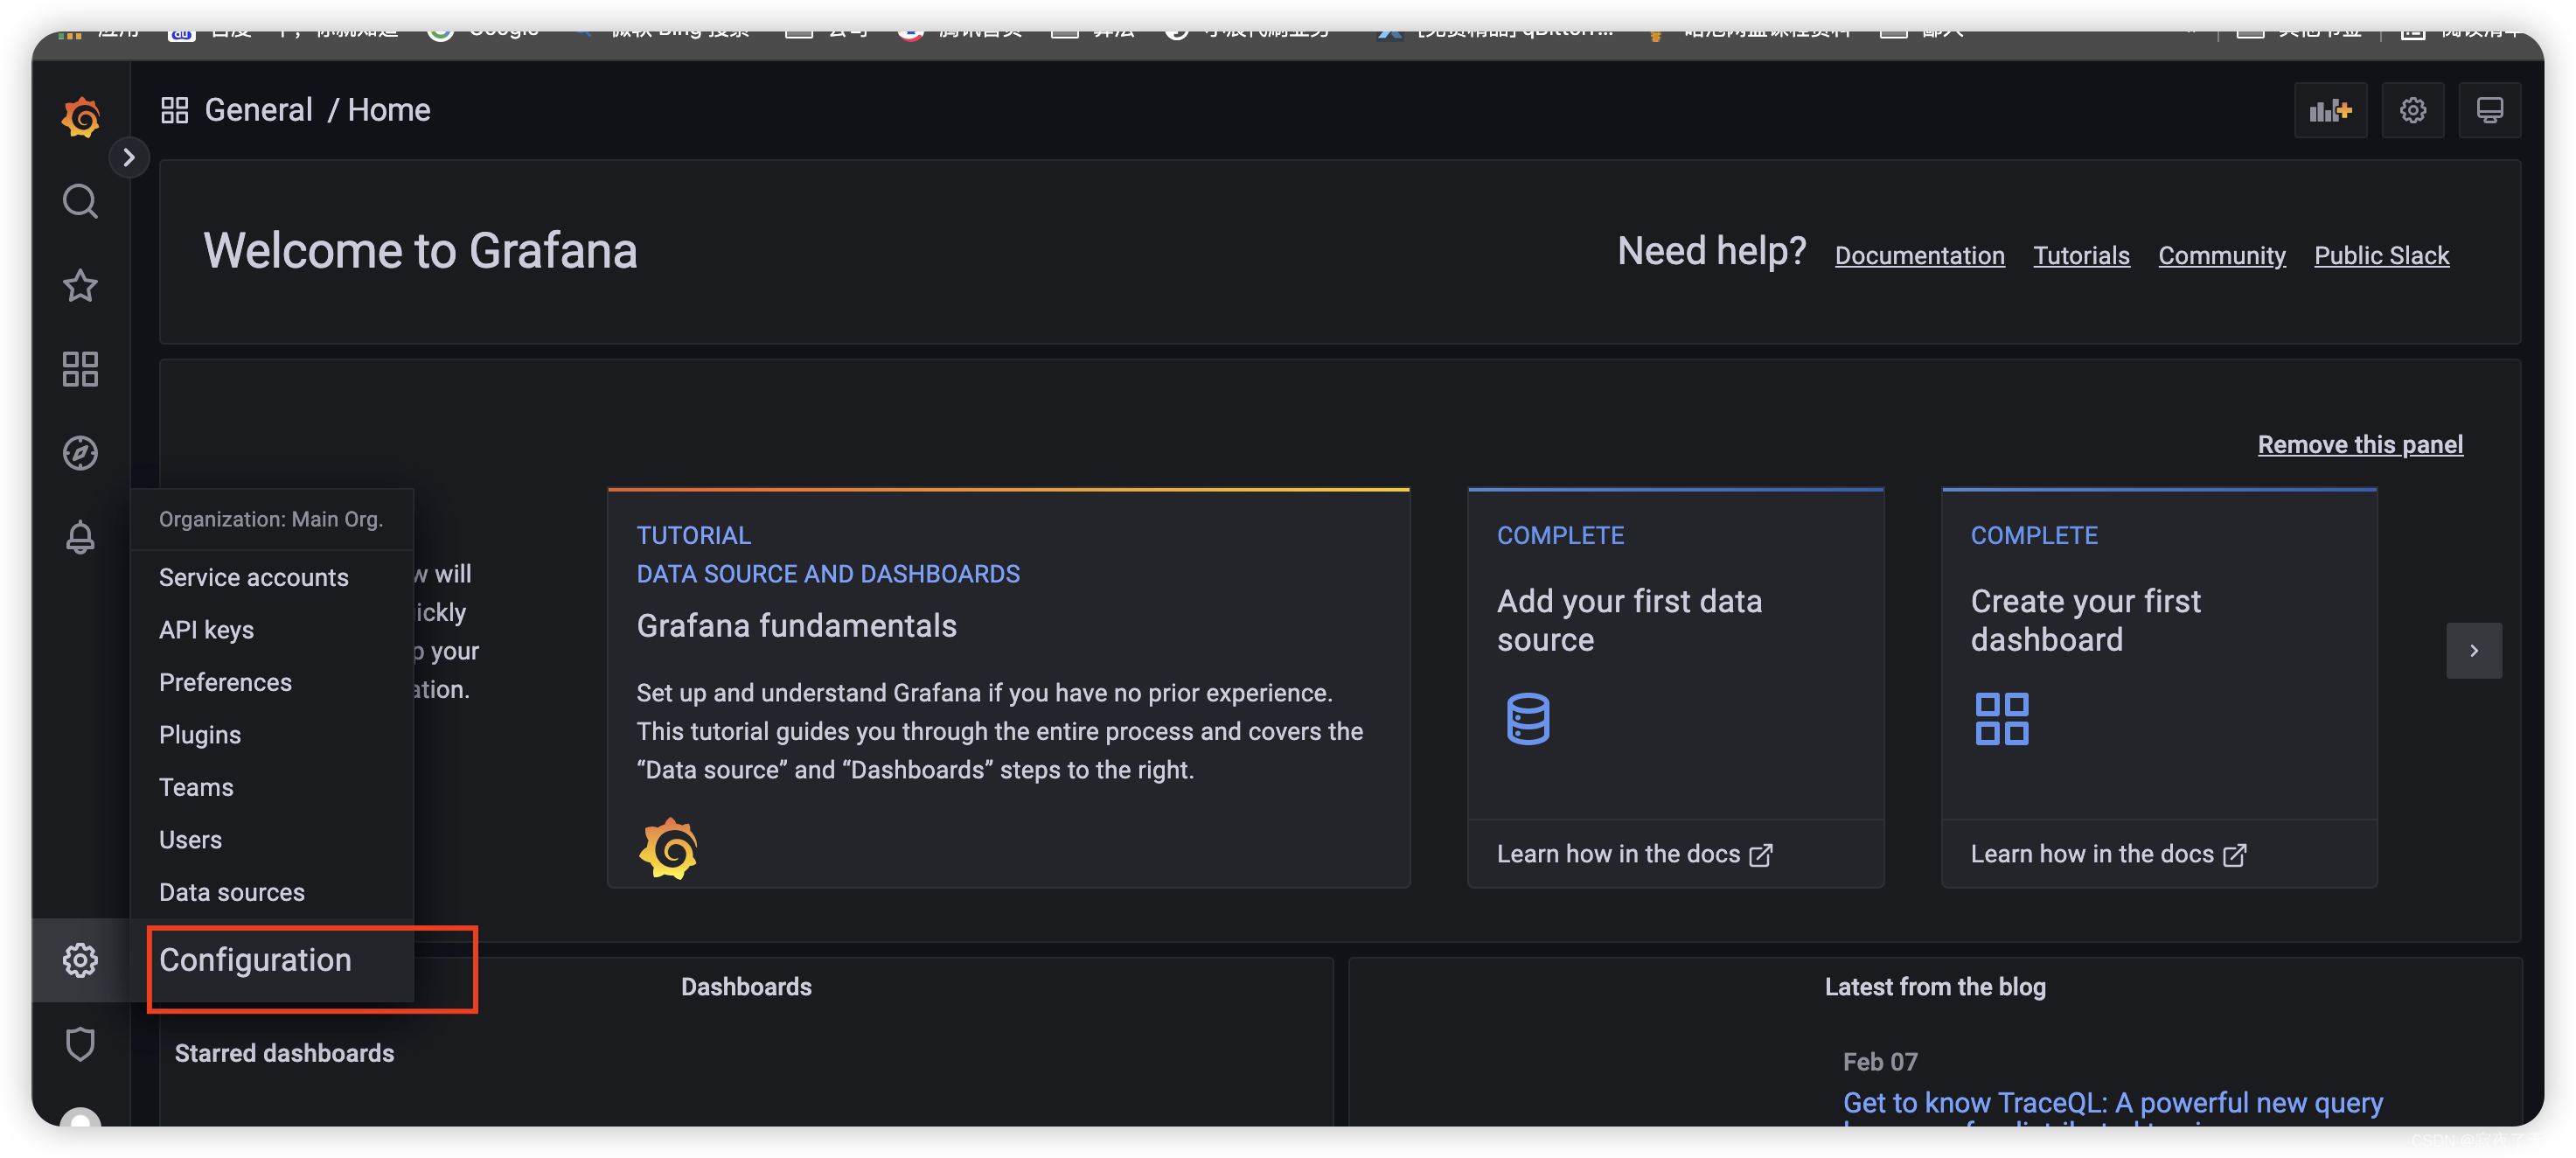
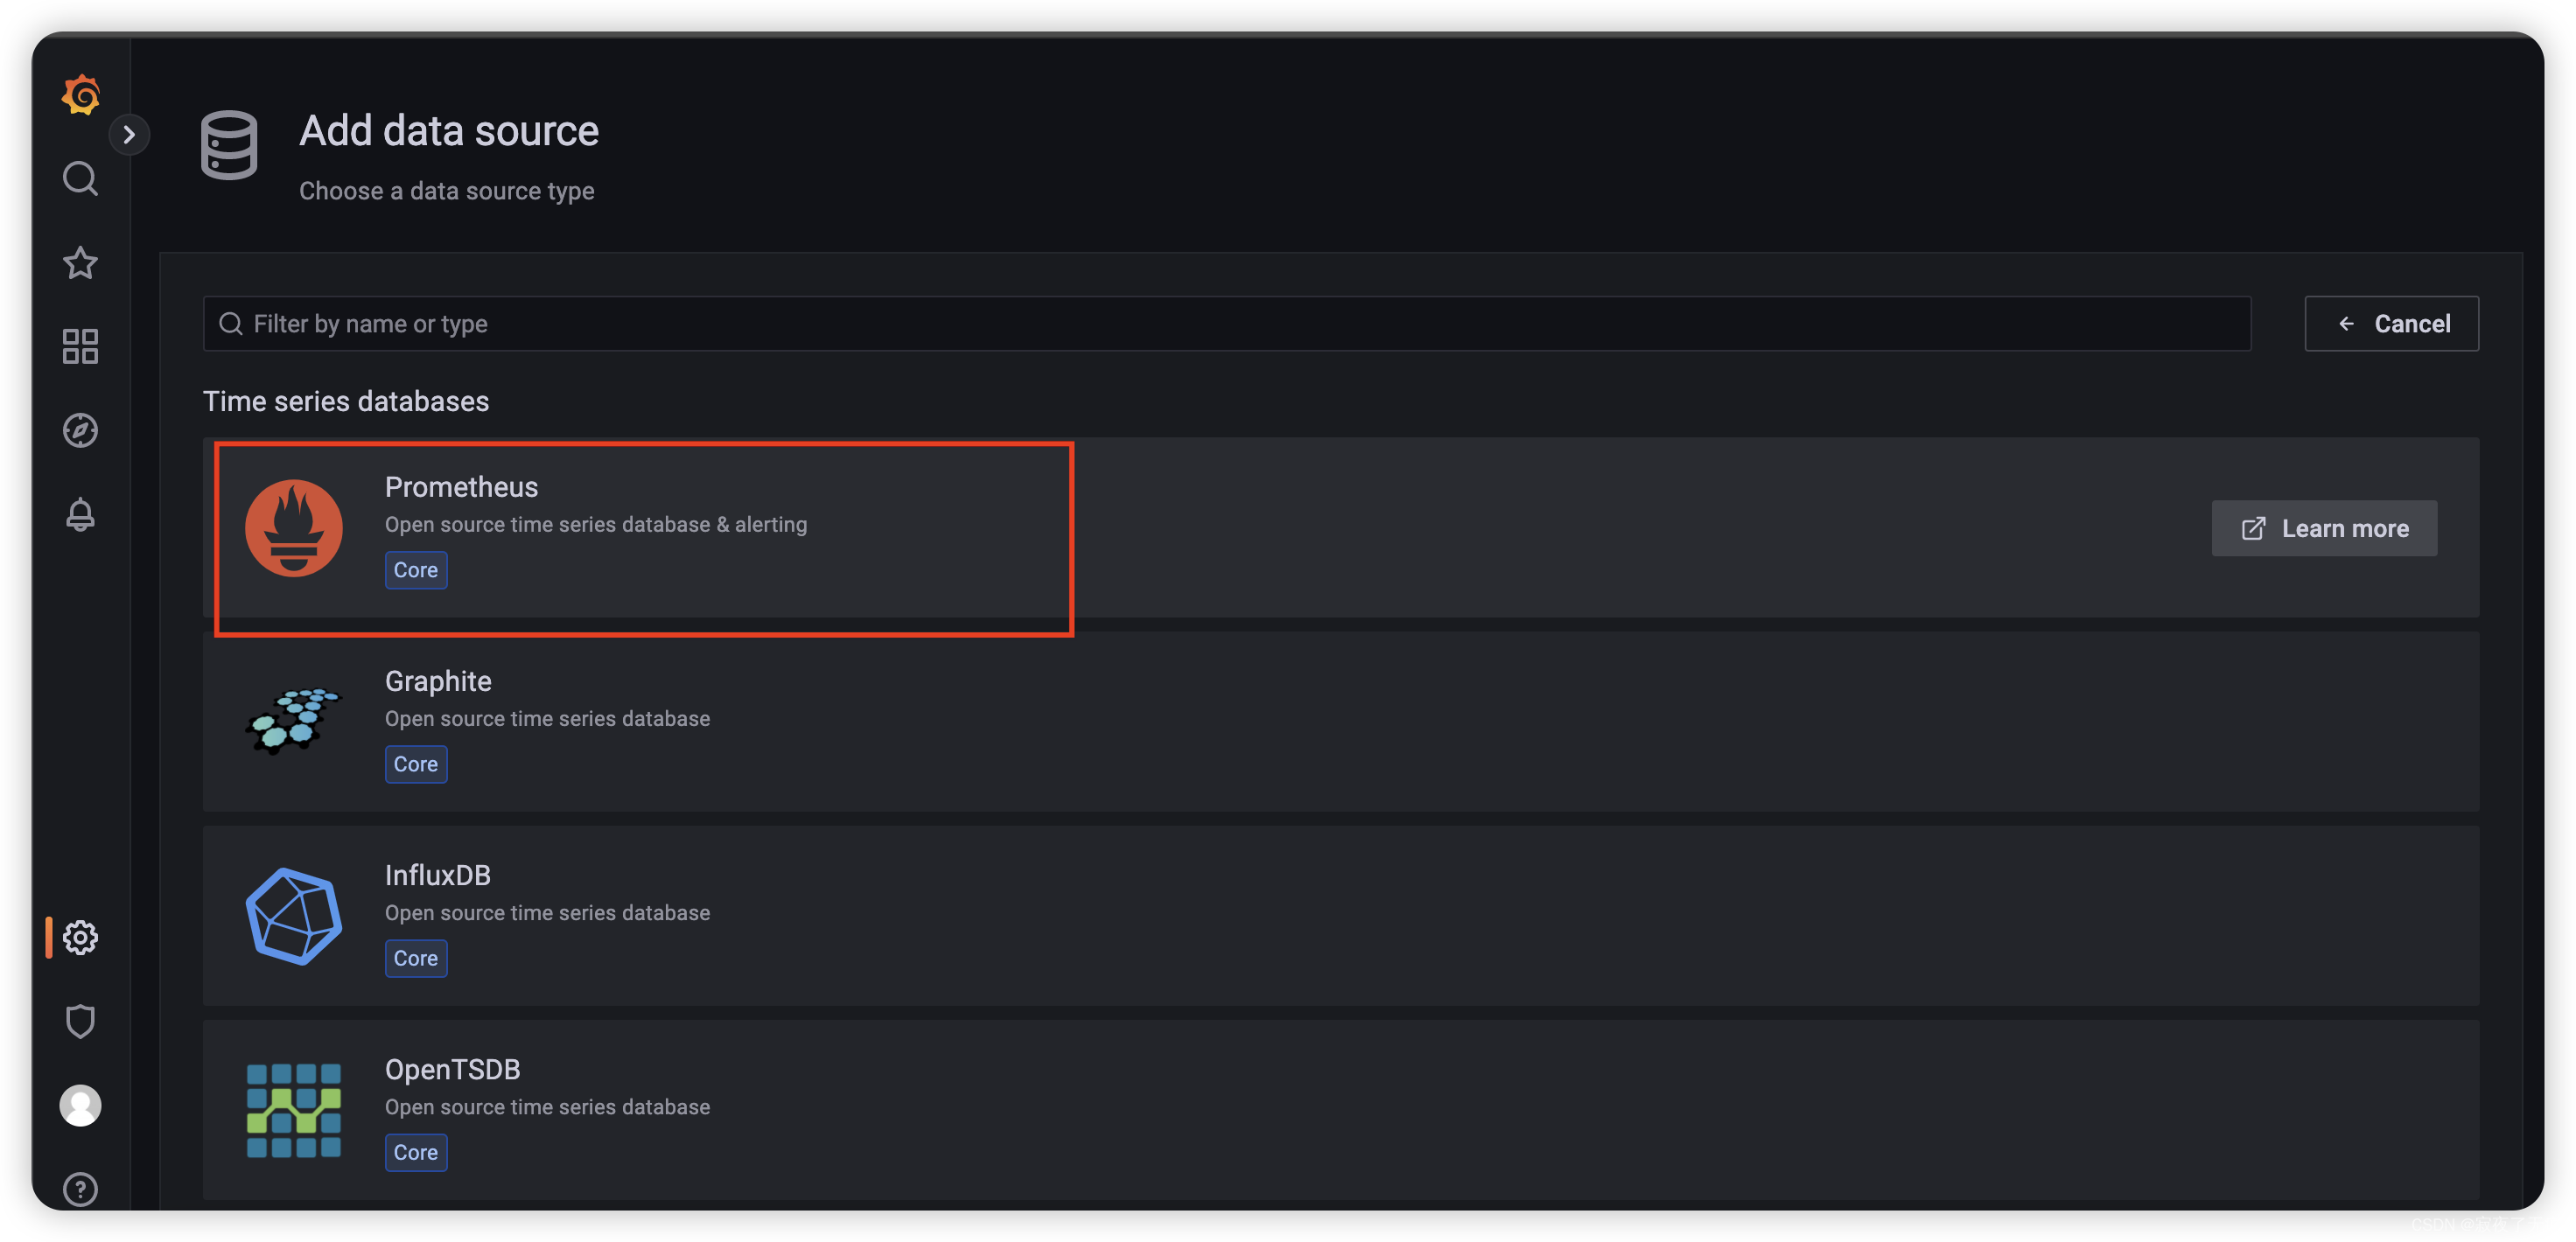
接下来我们会进行添加 一个数据源
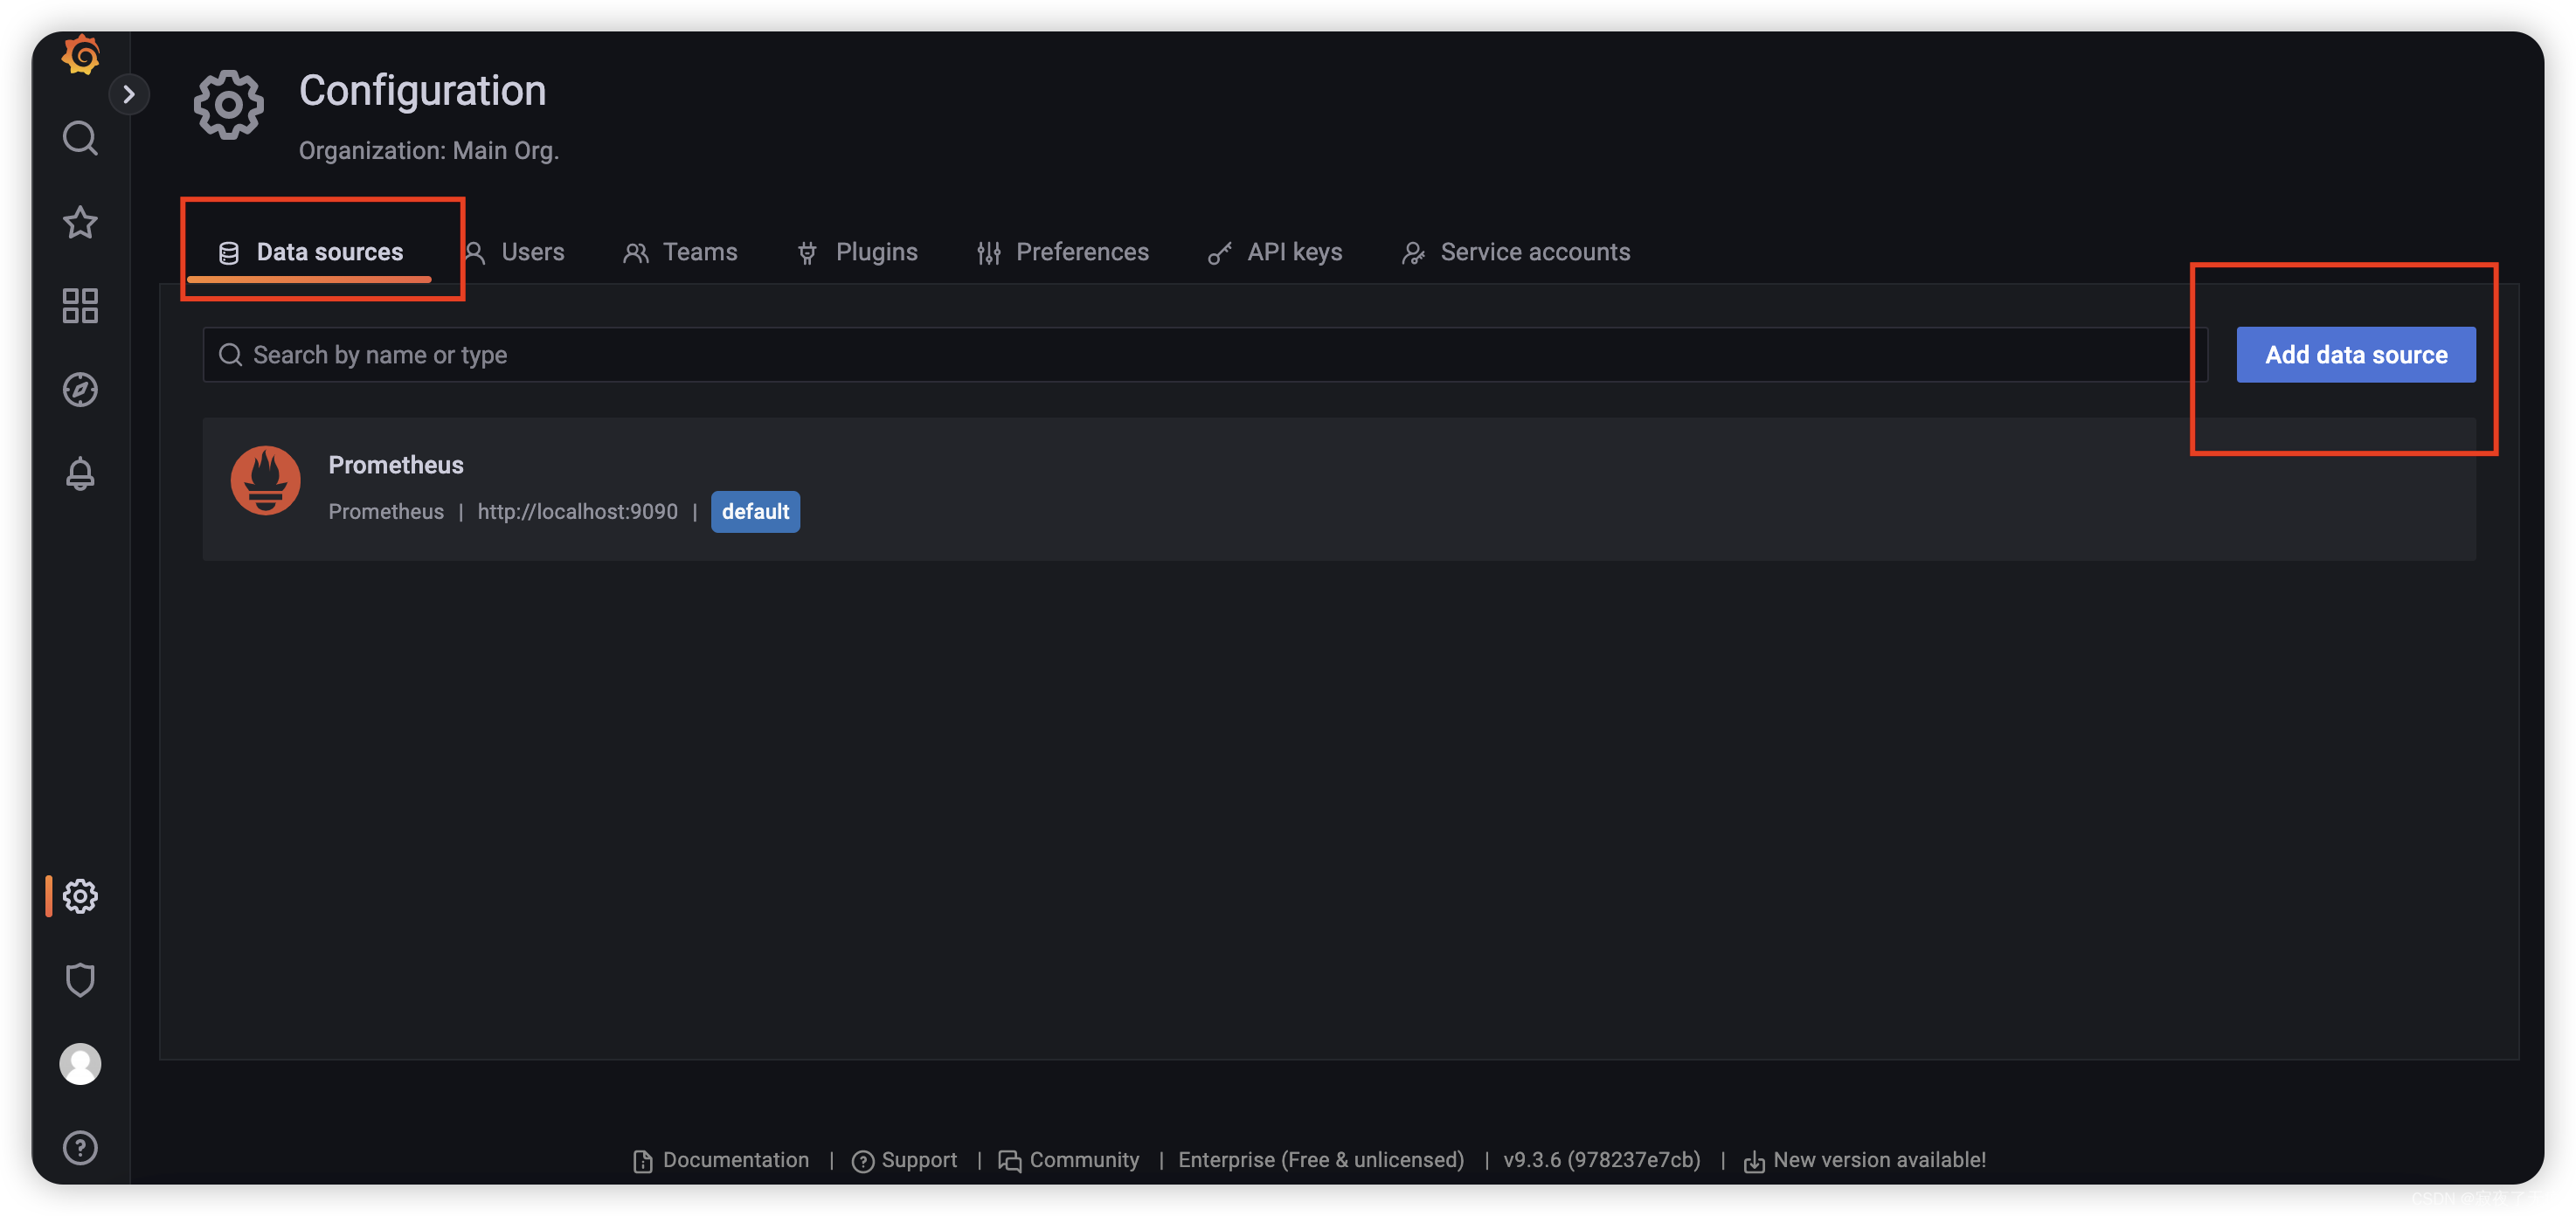
数据源这里 这里我们选择 promethus
填入 promethus 的url 默认localhost:9090
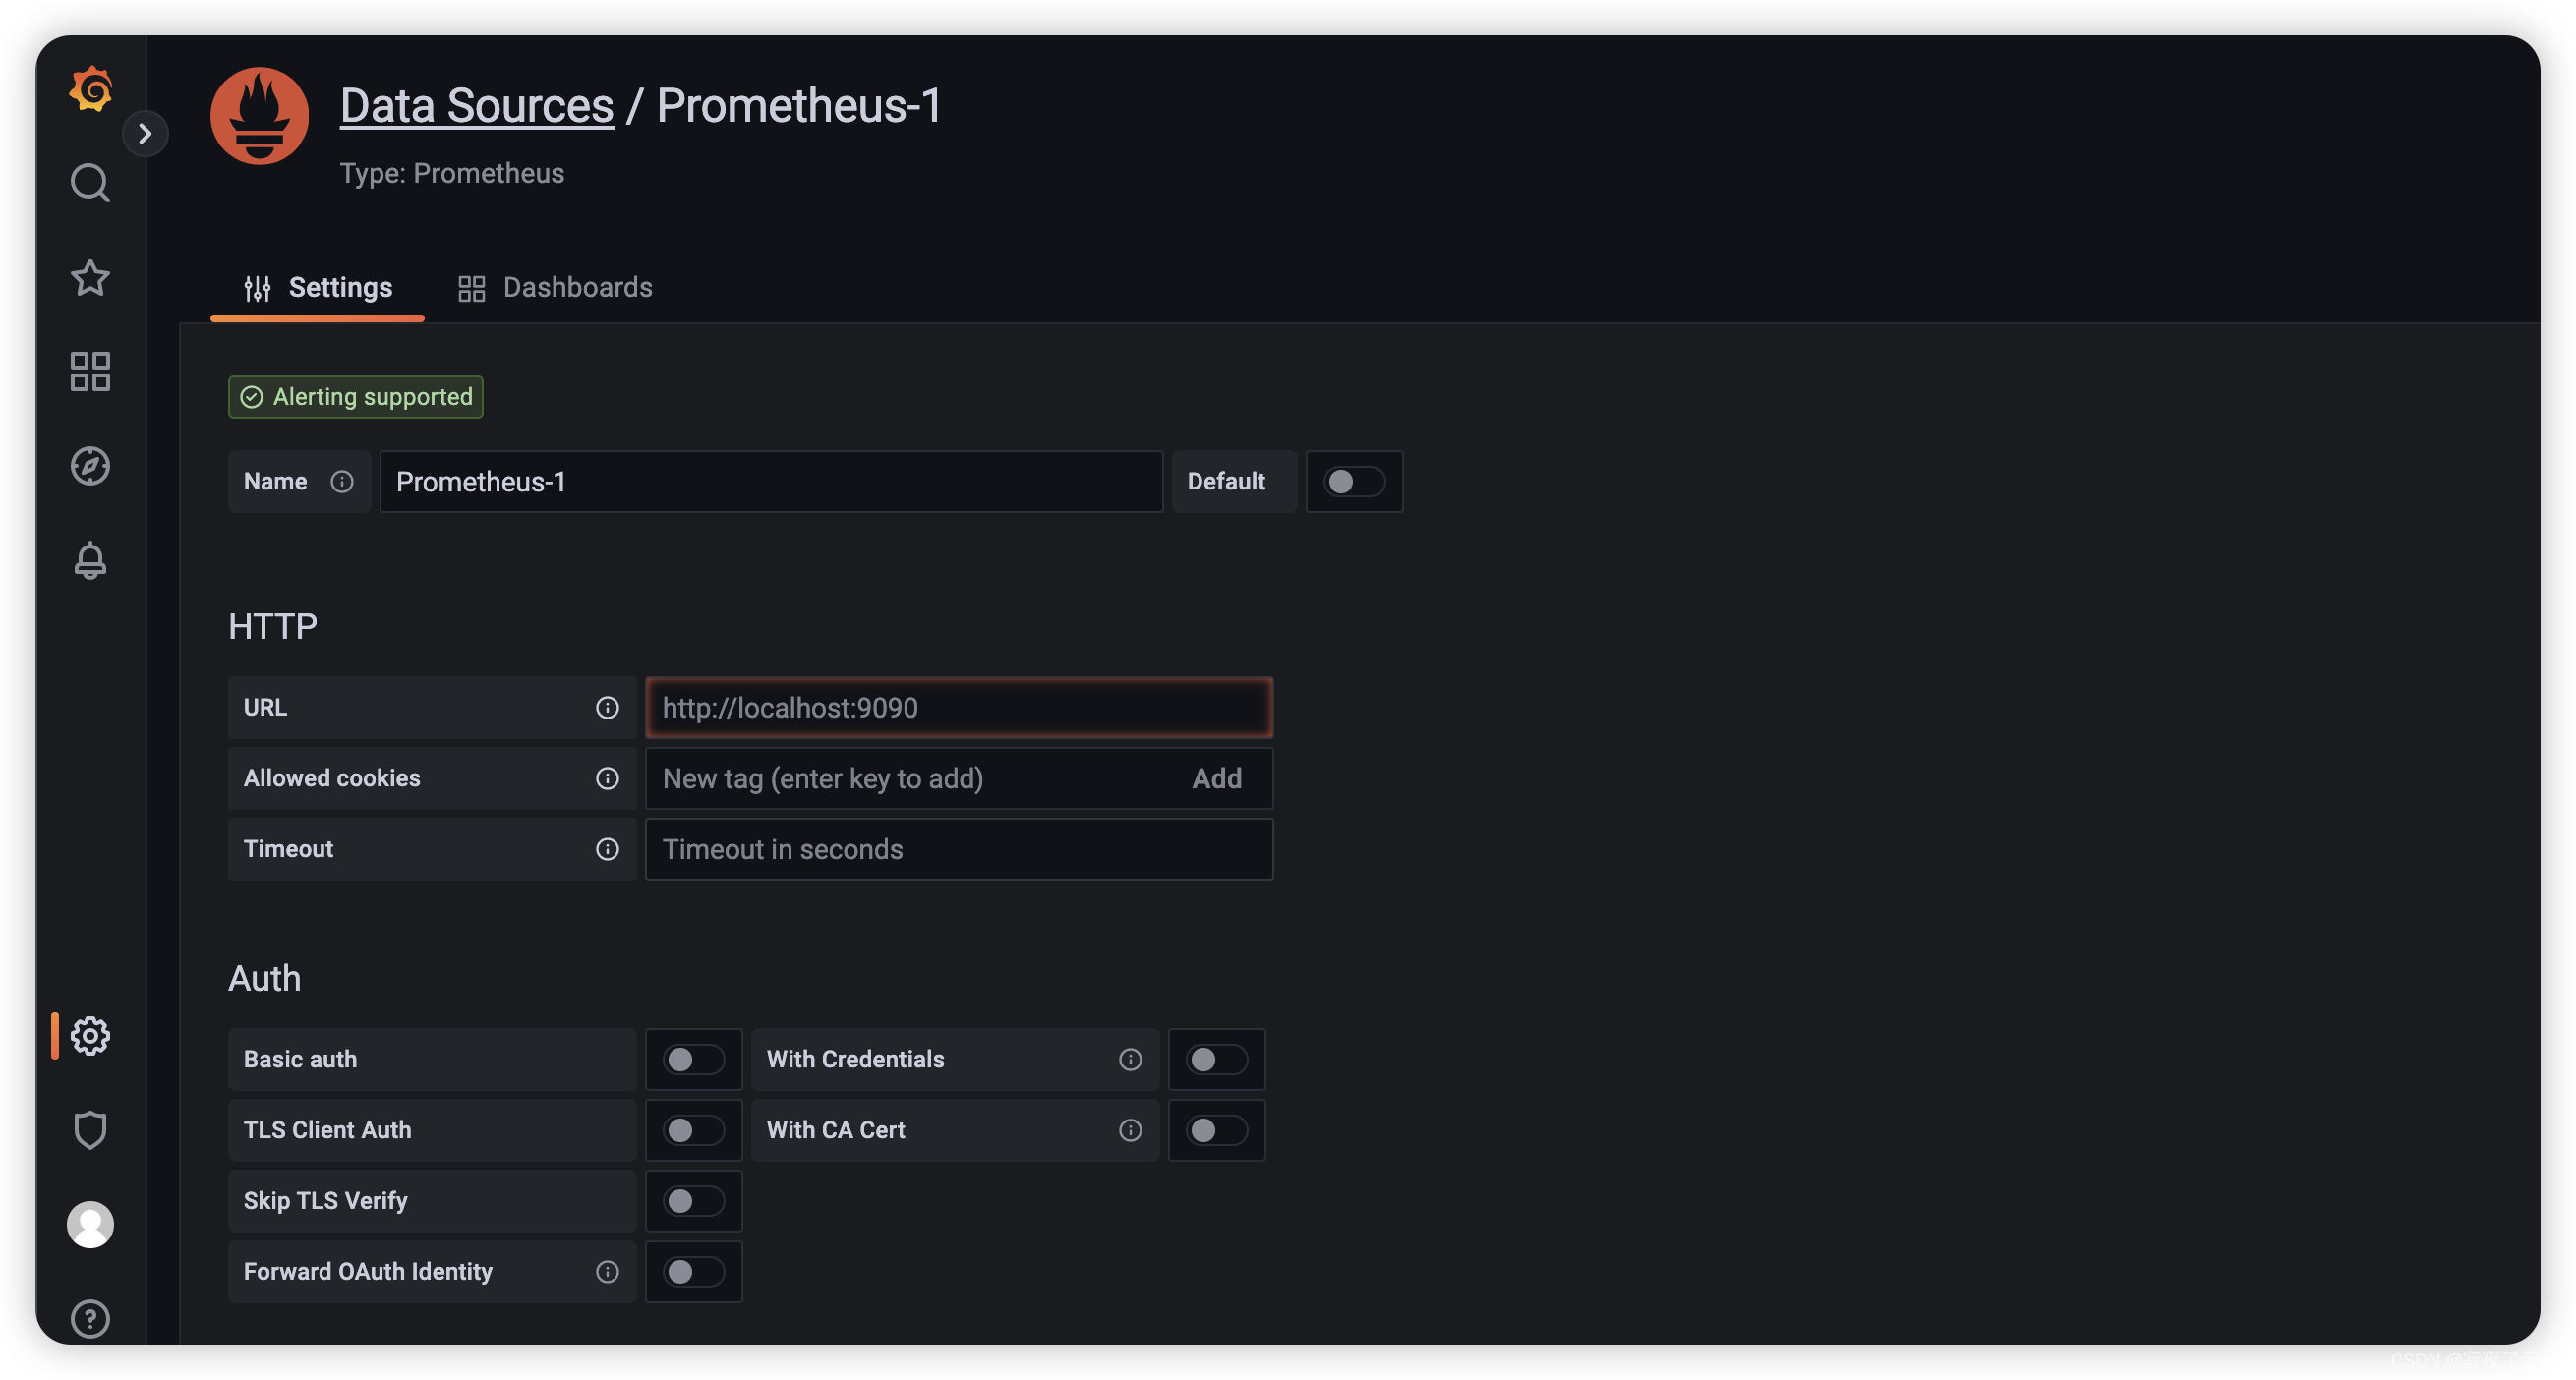
添加完 选择Save&test
9.4 配置 dashboard
配置好数据源之后,我们就可以配置对应的监控信息了,常见的配置监控已经有对应的模板了,就不需要我们一个一个地去配置了。(如果不满足的话,那还是得自己去配)
因为需要配置数据暴露 然后 交给 promethus 最后 Grafana 进行展示
所以分为四步执行
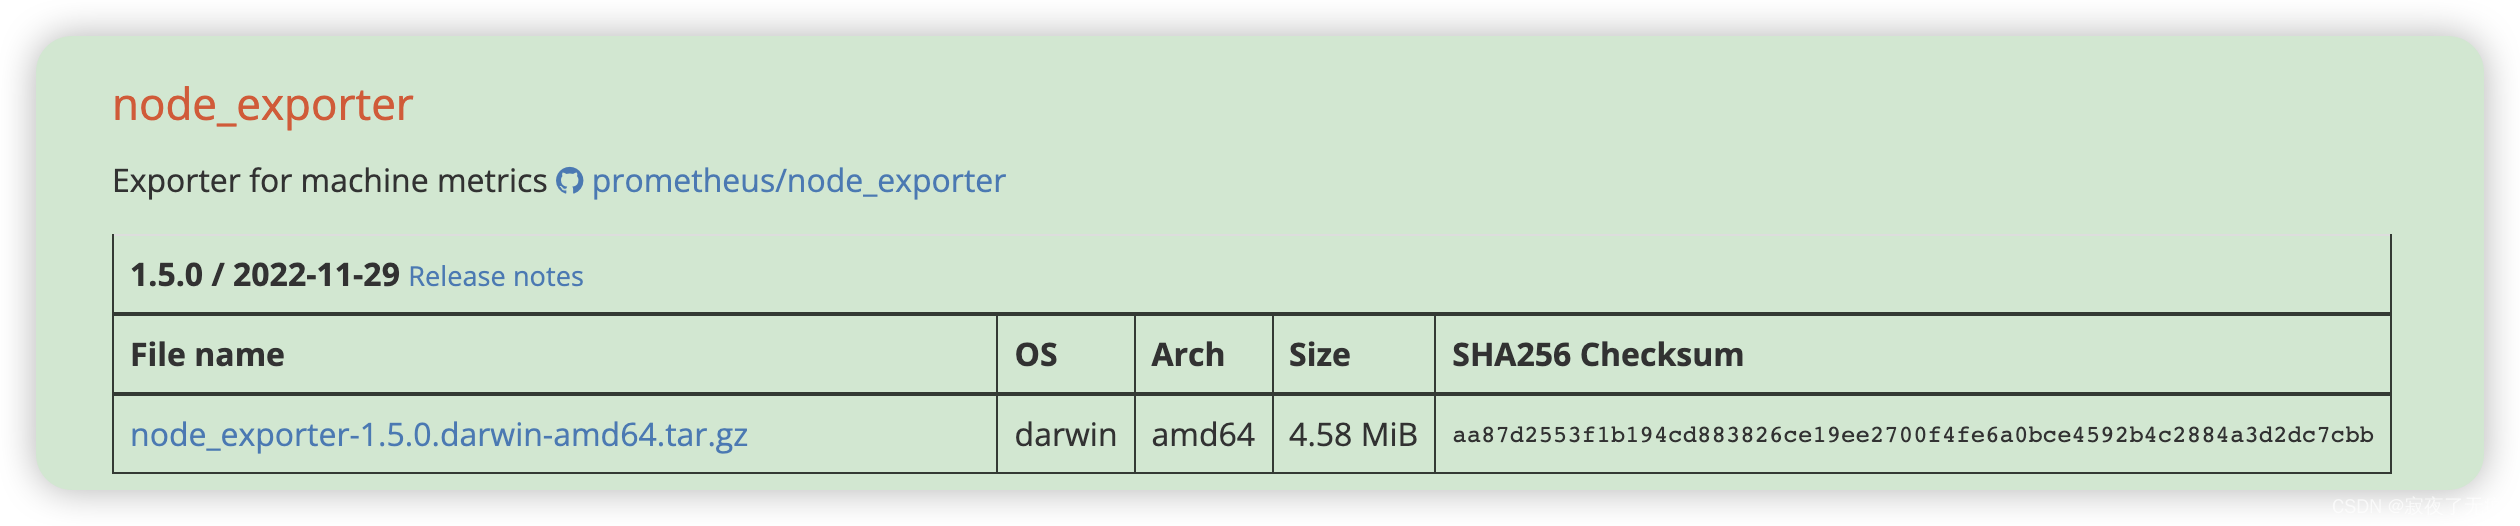
- 下载 记得选择与自己系统匹配的
首先我们需要下载node_exporter 用来采集服务器的数据 官方下载页面 https://prometheus.io/download/ 选择对应的操作系统以及架构 这里我们使用的时darwin amd64
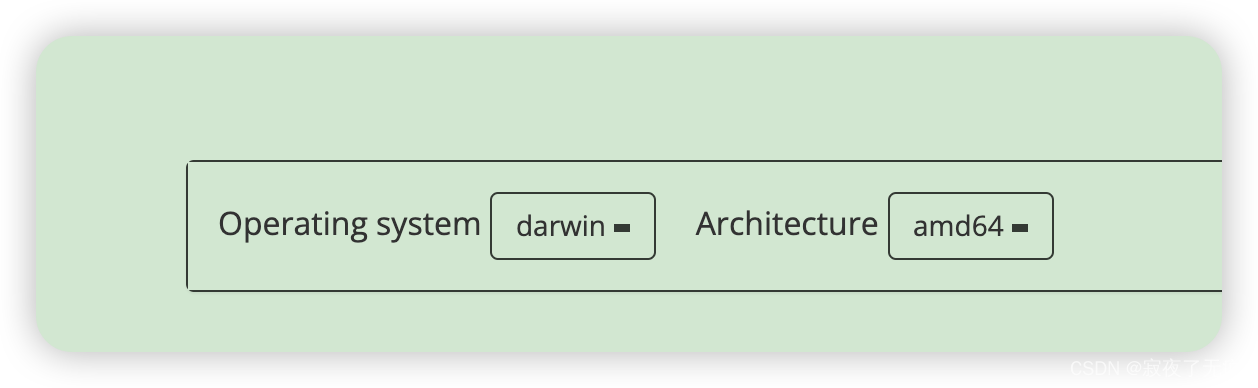
选择 node_exporter
-
启动
下载完成 解压后进行启动 进行解压目录 直接运行 ./node_exporter 即可完成启动 -
配置promethus 采集该数据
添加 job_name node 以及 targets localhost:9100 (node_exporter启动的默认端口为9100)
scrape_configs:# The job name is added as a label `job=<job_name>` to any timeseries scraped from this config.- job_name: "prometheus"# metrics_path defaults to '/metrics'# scheme defaults to 'http'.static_configs:- targets: ["localhost:9090"]#node 是需要新加的- job_name: nodestatic_configs:- targets: ['localhost:9100']
配置修改完成 进行启动 ./prometheus --config.file=prometheus.yml
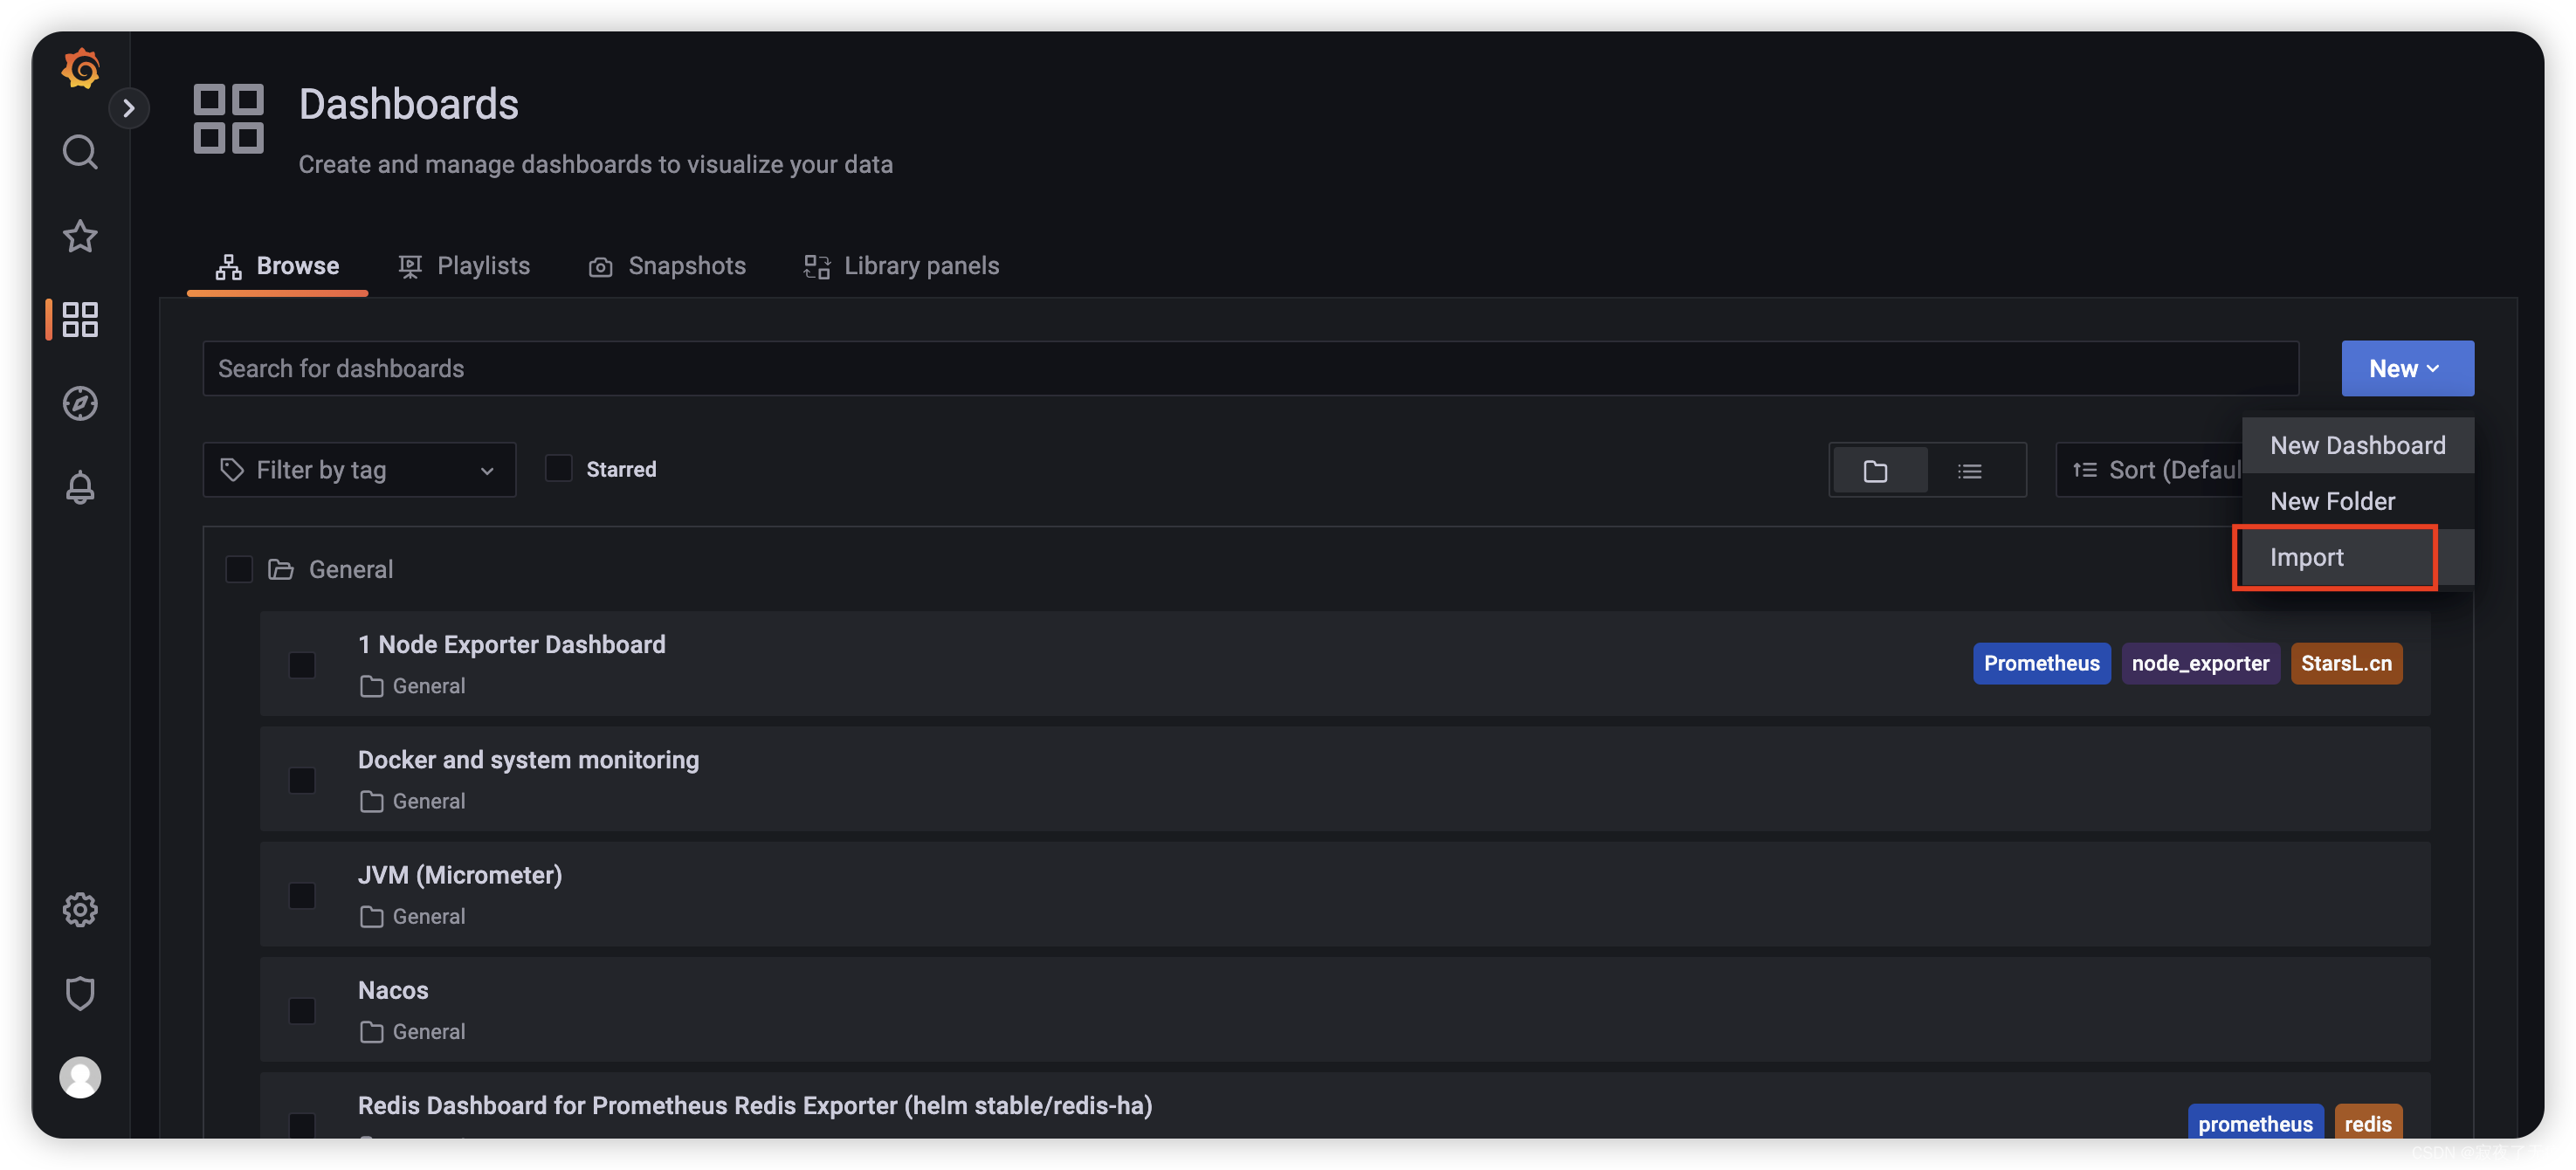
- 然后直接import对应的模板,相关的模板可以在https://grafana.com/grafana/dashboards/ 这里查到。
选择dashboard 然后导入
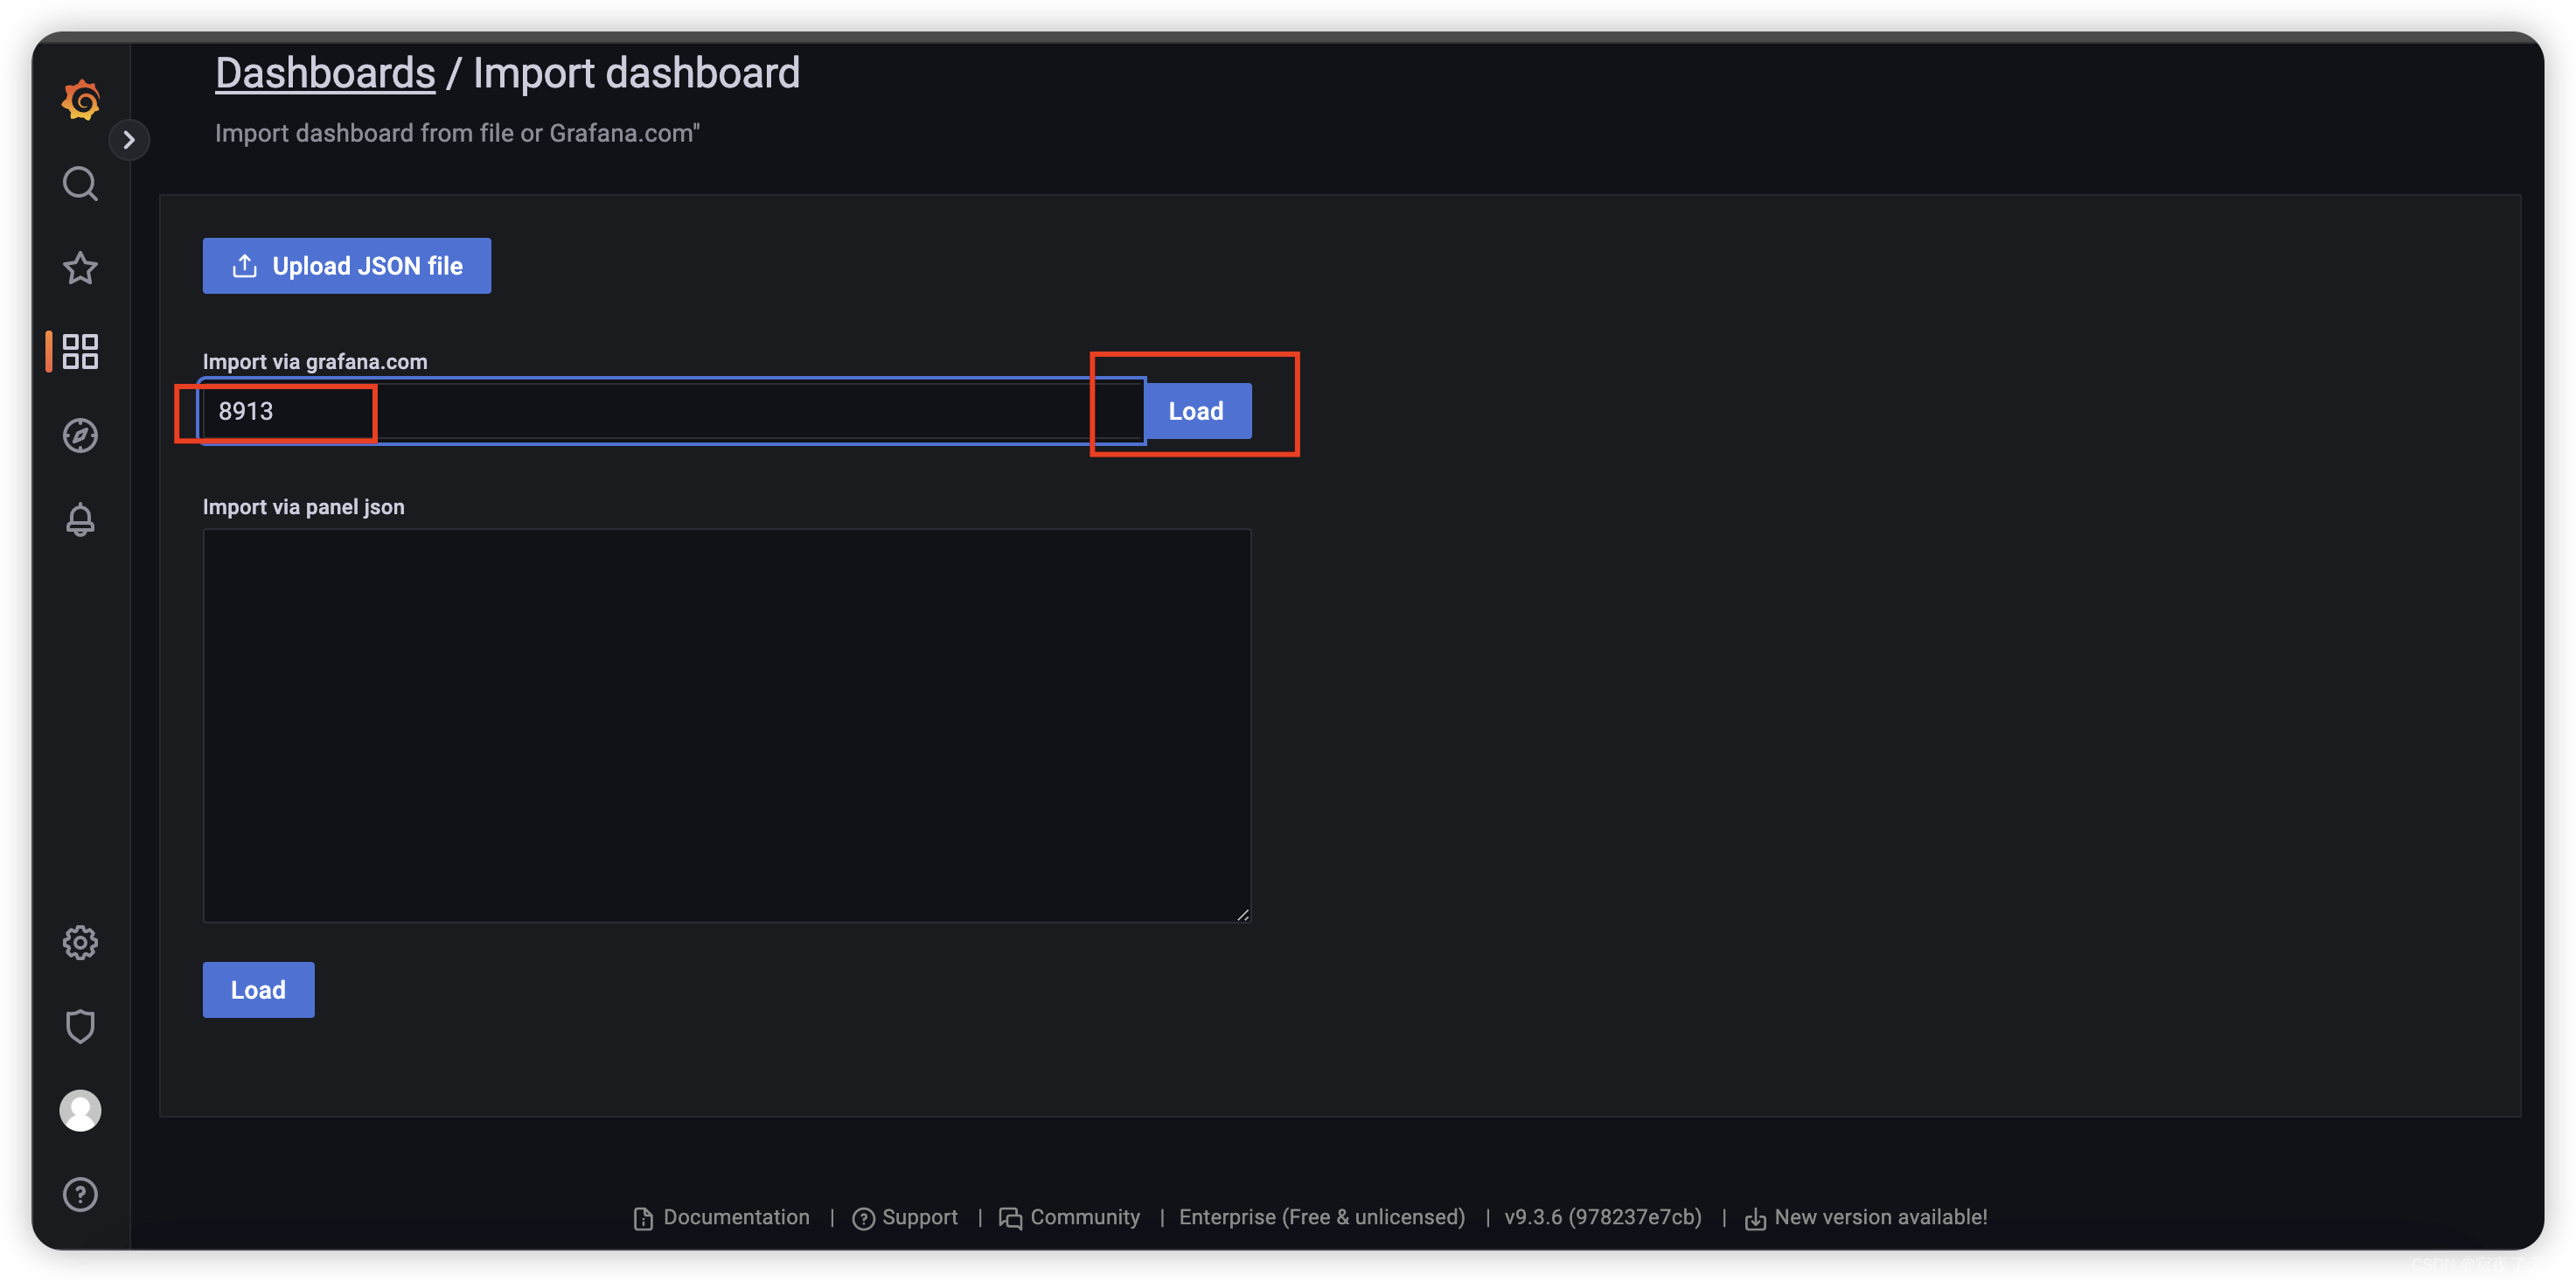
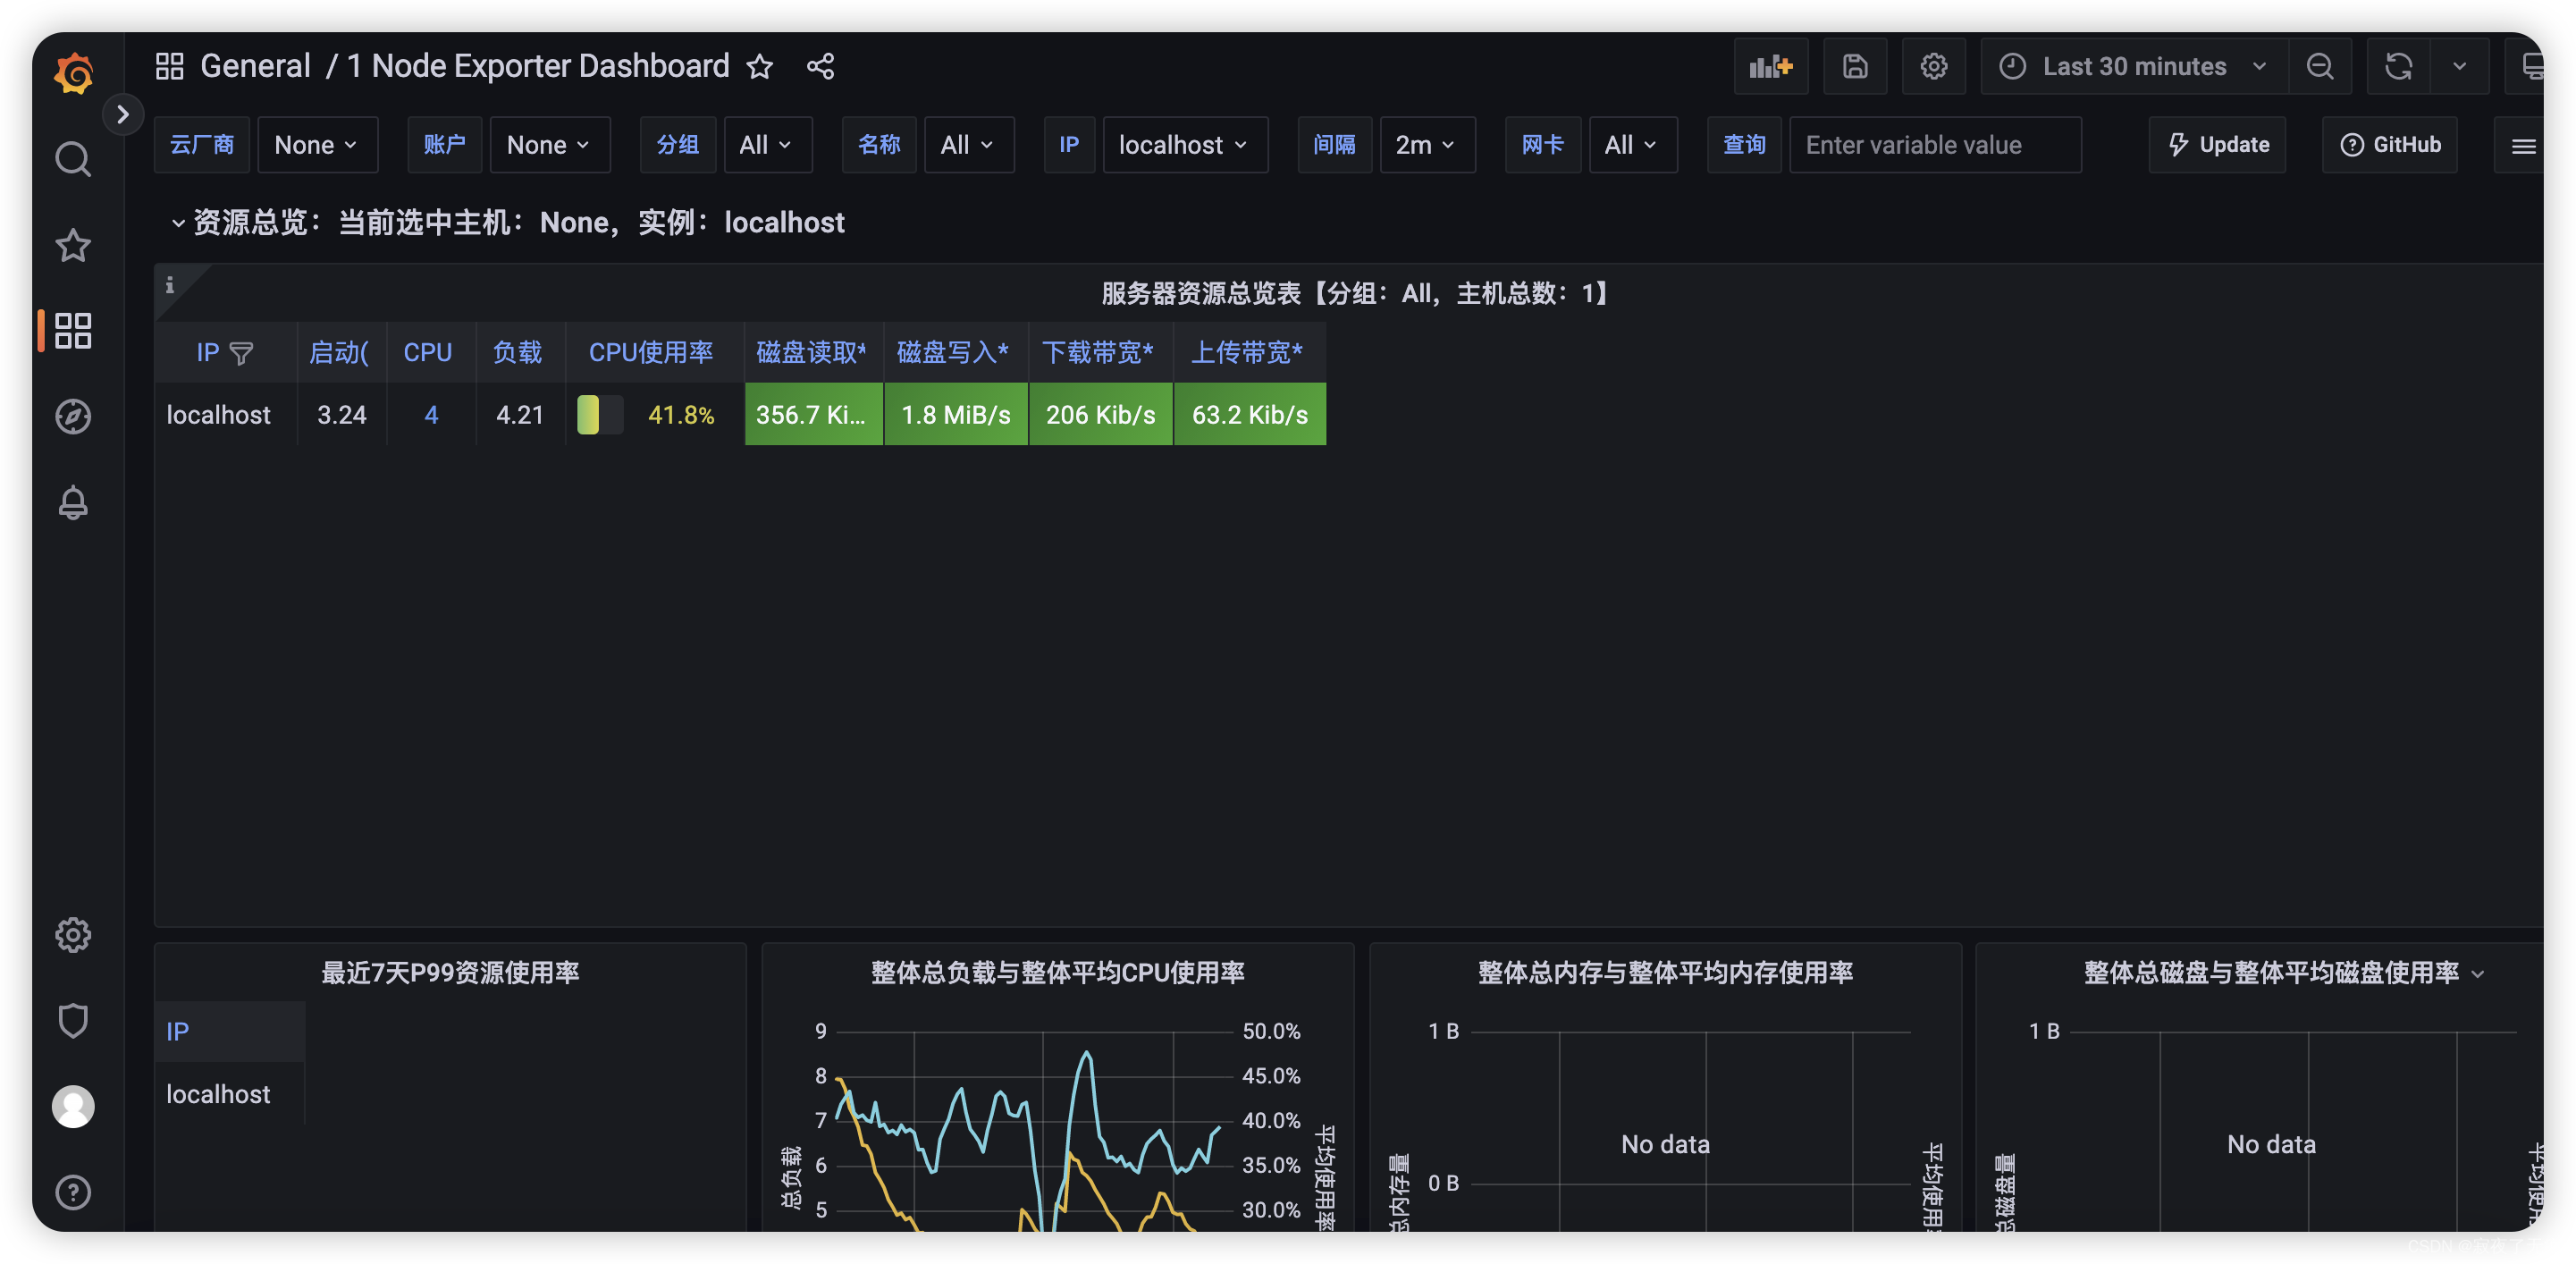
服务器的监控直接选用8913 保存后即可看到 相关界面
界面效果图如下
tips: 查看promethus 采集的到端点 http://localhost:9090/targets 9090为promethus 默认的端口 看到都是自己所配置端点的状态为up,那就说明正常。
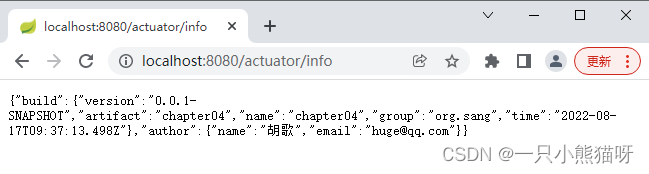
9.5 监控Java项目
- maven项目添加依赖
<!--actuator 监控-->
<dependency><groupId>org.springframework.boot</groupId><artifactId>spring-boot-starter-actuator</artifactId>
</dependency>
<!--适配prometheus-->
<dependency><groupId>io.micrometer</groupId><artifactId>micrometer-registry-prometheus</artifactId>
</dependency>
- 对外暴露相关端点
#这里为了方面 对外暴露了所有的监控数据  生产环境切记不要这么干
management.endpoint.health.show-details=always
management.endpoint.metrics.enabled=true
management.endpoint.prometheus.enabled=true
management.endpoints.web.exposure.include=*
management.metrics.export.prometheus.enabled=true
- 配置promethus采集数据
scrape_configs:# The job name is added as a label `job=<job_name>` to any timeseries scraped from this config.- job_name: "prometheus"#metrics_path defaults to '/metrics'# scheme defaults to 'http'.static_configs:- targets: ["localhost:9090"]- job_name: nodestatic_configs:- targets: ['localhost:9100'] - job_name: gateway-servicemetrics_path: '/actuator/prometheus'static_configs:#9091为启动应用端口号- targets: ['localhost:9091']
- 重新启动 promethus
- dashboard 添加 JVM监控和Springboot监控
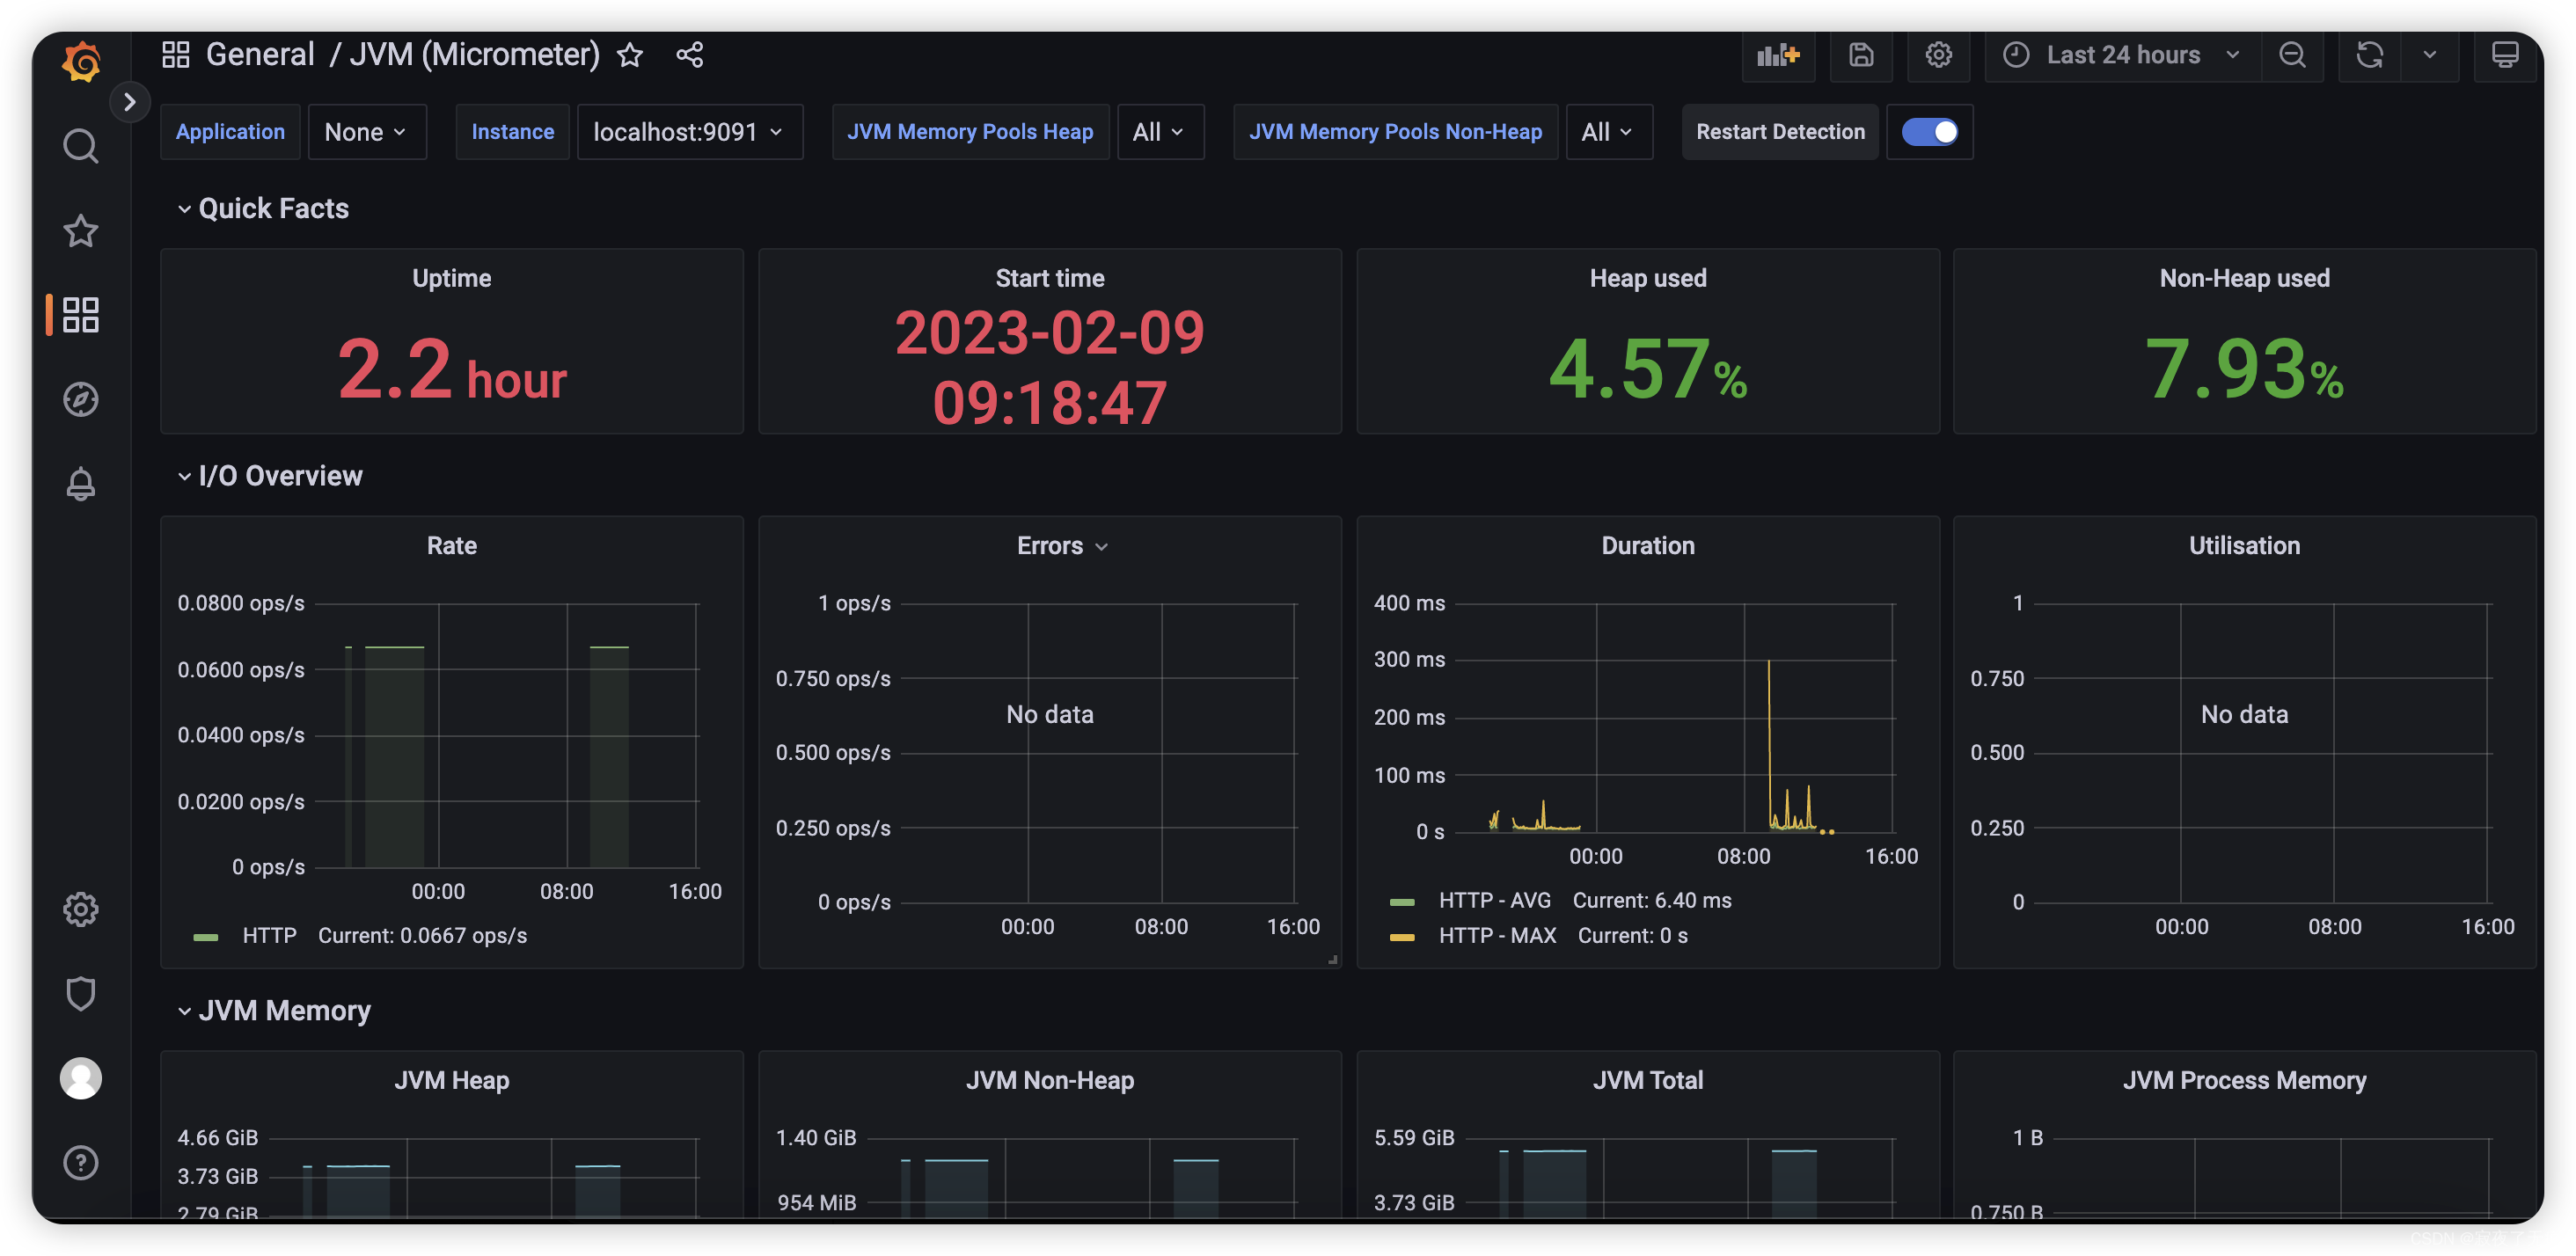
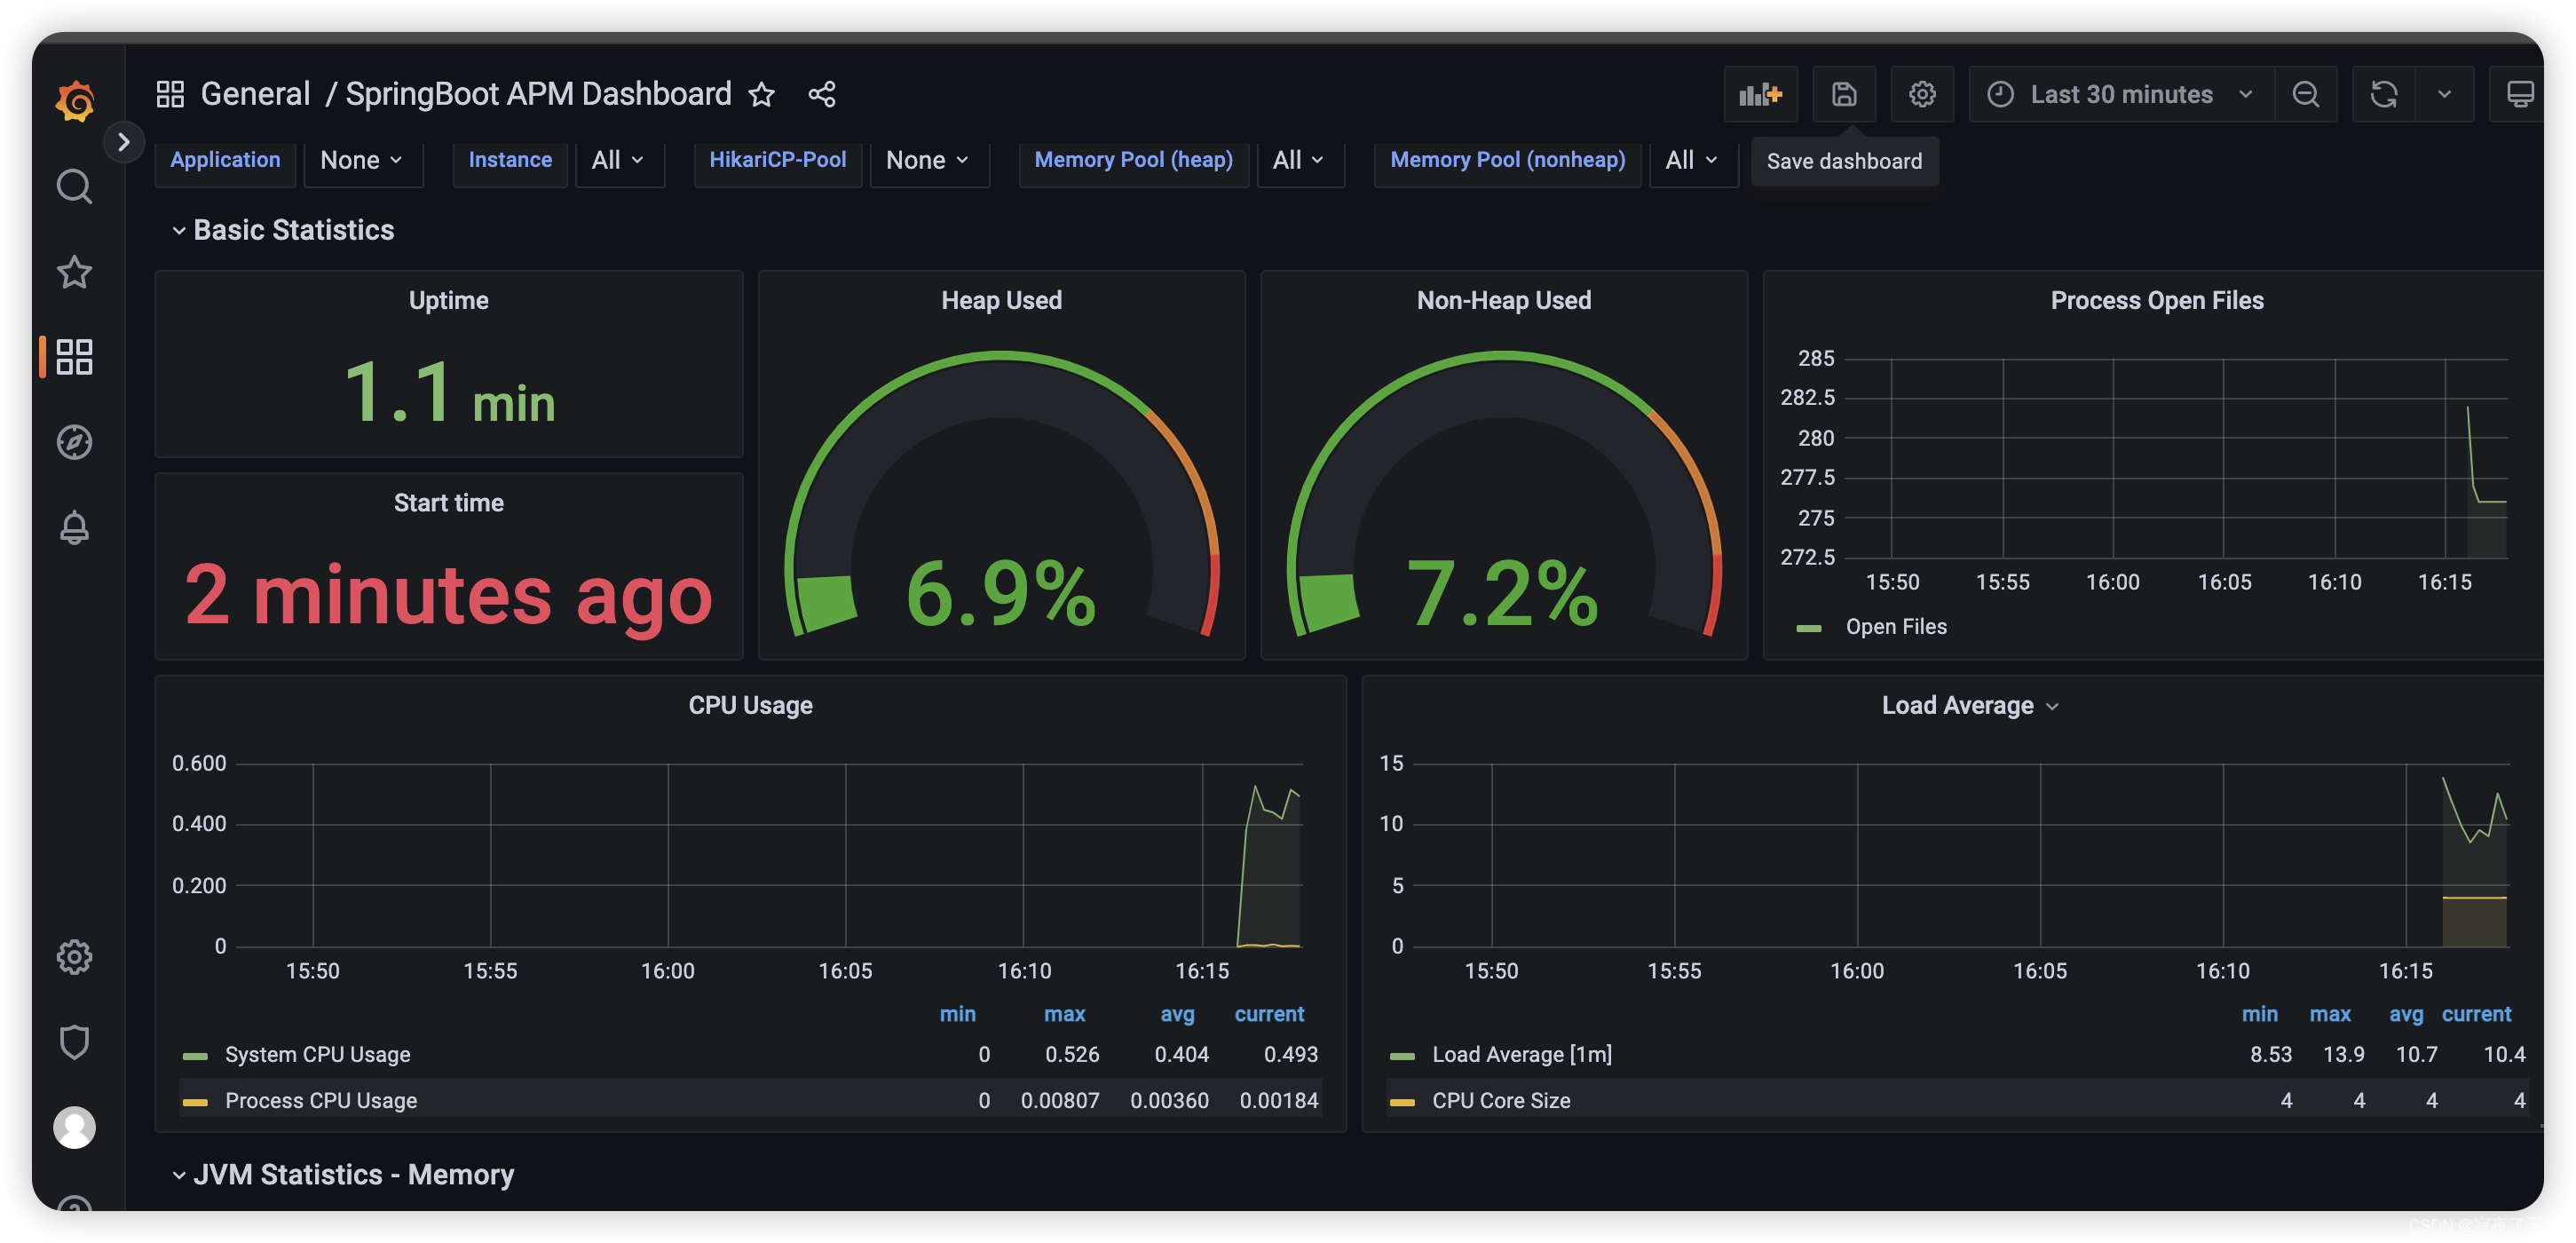
在dashboard 添加 JVM监控和Springboot监控 这里选择4701模板的JVM监控和12900模板的SpringBoot监控
分别看下效果
JVM监控
springboot 监控
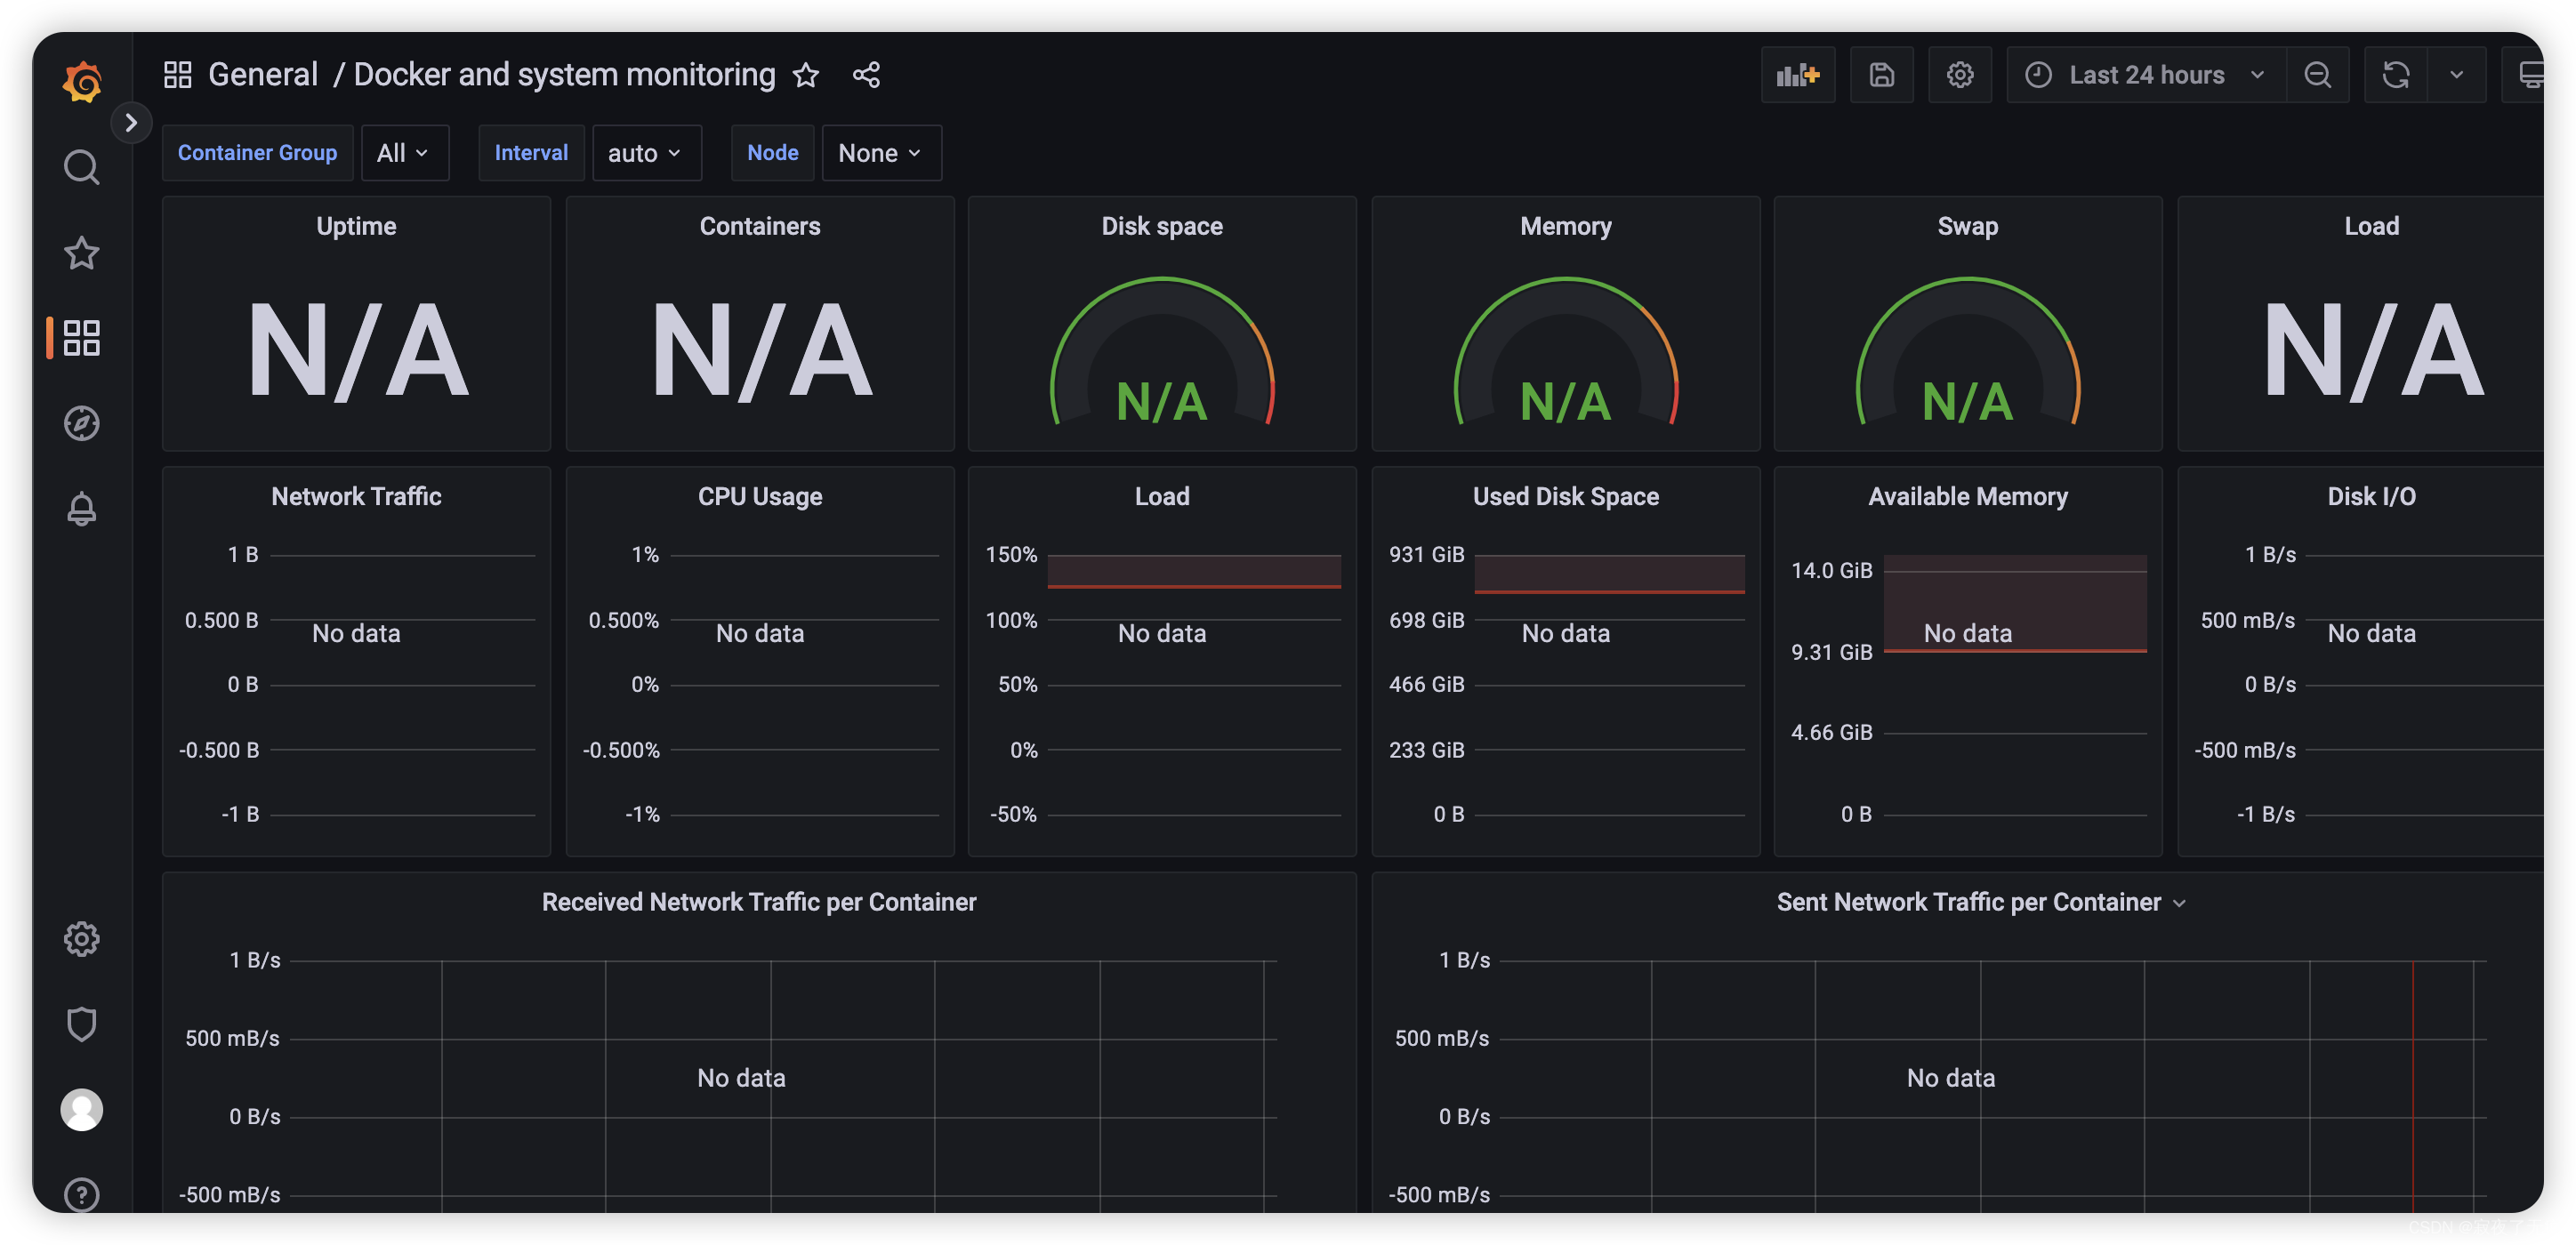
配置 模板893来配置监控docker的信息:
难道又要结束了么 当然no~~~ 接下来进入到告警的环节
10.告警
这里使用告警 工具是 AlterManager
10.1 AlterManager介绍
Alertmanager处理客户端应用程序(如Prometheus服务器)发送的警报。它负责重复数据删除、分组,并将它们路由到正确的接收器集成,如电子邮件、PagerDuty或OpsGenie。它还负责静音和抑制警报。
10.2 告警流程介绍
告警流程大概有四大步骤
- 在promethus配置告警信息 以及 alterManager
- 告警信息触发.
- promethus推送告警信息到alterManager
- alterManager接收到告警信息并根据不同方式传输到指定位置(邮件 etc 钉钉 等等)
10.3 AlterManager下载安装 配置
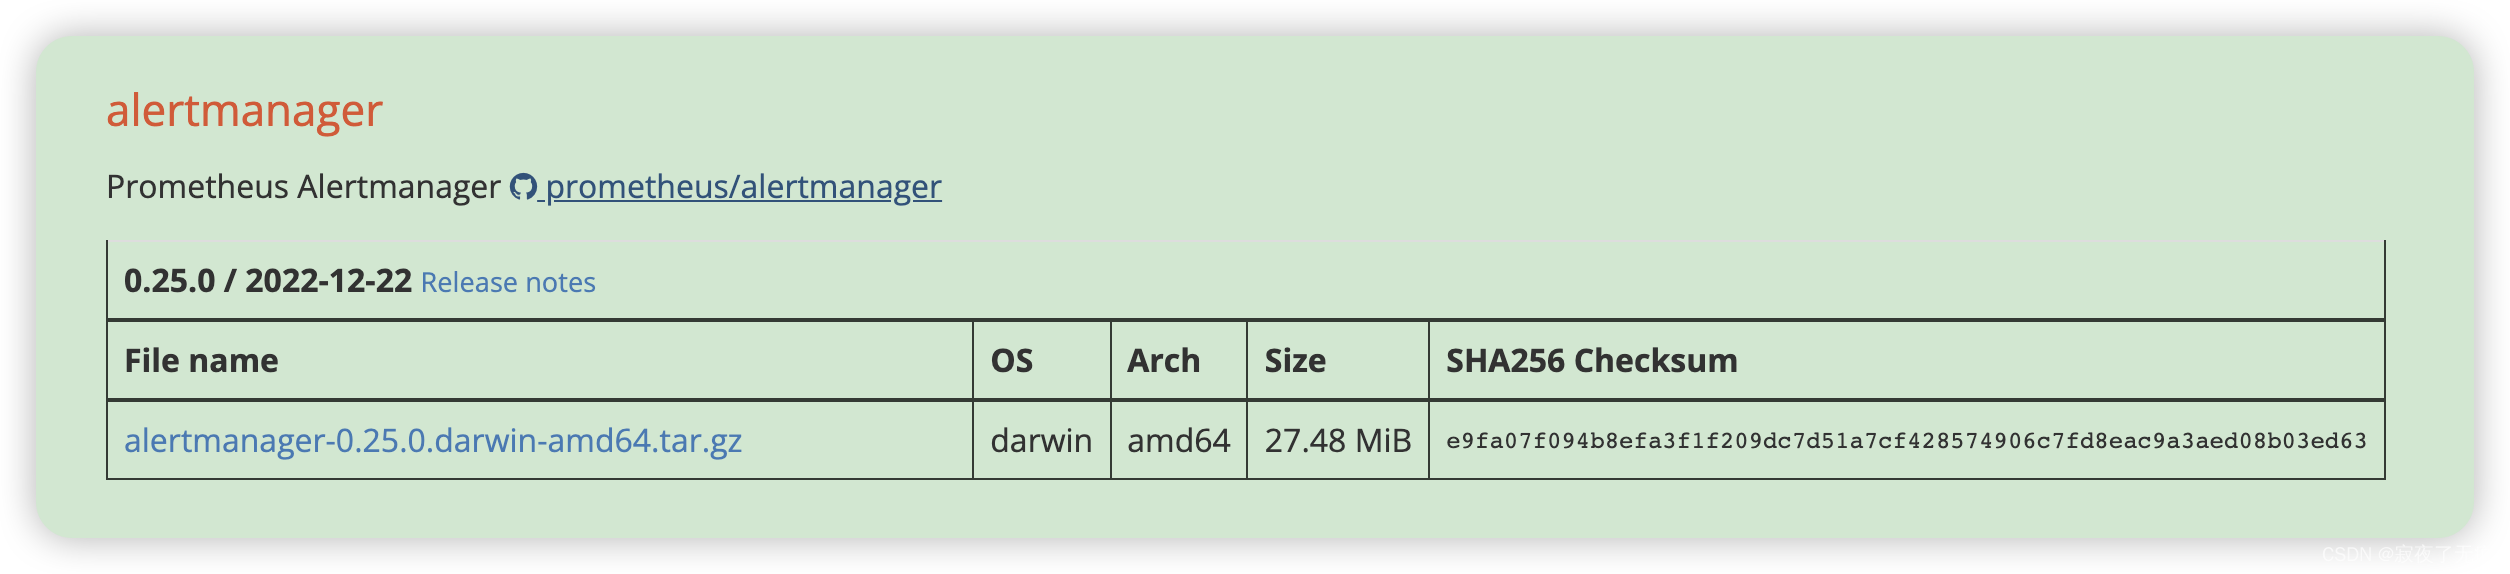
- 下载安装Alertmanager 地址 https://prometheus.io/download/ 选择操作系统和架构进行下载
- 解压
- 配置修改(更为详细的文档 https://prometheus.io/docs/alerting/latest/configuration/)
route:group_by: ['test']group_wait: 30sgroup_interval: 5mrepeat_interval: 1hreceiver: 'web.hook'
receivers:- name: 'web.hook'webhook_configs:#这个地址又是另外一个东西  prometheus-webhook-dingtalk- url: 'http://localhost:8060/dingtalk/webhook1/send'
- 启动 ./alertmanager --config.file=alertmanager.yml
10.4 配置告警规则 以及promethus
- 配置告警规则 建议放在promethus安装目录
- 在promethus安装目录下新建 alerts.yml
- 内容如下
# This is the rules file.groups:
- name: examplerules:- alert: InstanceDownexpr: up == 0for: 3mlabels:severity: pageannotations:summary: "Instance {{ $labels.instance }} down"description: "{{ $labels.instance }} of job {{ $labels.job }} has been down for more than 5 minutes."- alert: AnotherInstanceDownexpr: up == 0for: 10mlabels:severity: pageannotations:summary: "Instance {{ $labels.instance }} down"description: "{{ $labels.instance }} of job {{ $labels.job }} has been down for more than 5 minutes."
这个规则的含义 当应用下线后 第一个规则会等待3分钟 如果还没恢复就会发送告警邮件 恢复后就不发送了 第二个规则 等待10分钟 同理
- 配置promethus
# my global config
global:scrape_interval: 15s # Set the scrape interval to every 15 seconds. Default is every 1 minute.evaluation_interval: 15s # Evaluate rules every 15 seconds. The default is every 1 minute.# scrape_timeout is set to the global default (10s).# Alertmanager configuration
alerting:alertmanagers:- static_configs:#alertmanager 服务 端口默认9093- targets: ['localhost:9093']
# Load rules once and periodically evaluate them according to the global 'evaluation_interval'.
rule_files:# - "first_rules.yml"# - "second_rules.yml"- "alerts.yml"# A scrape configuration containing exactly one endpoint to scrape:
# Here it's Prometheus itself.
scrape_configs:# The job name is added as a label `job=<job_name>` to any timeseries scraped from this config.- job_name: "prometheus"# metrics_path defaults to '/metrics'# scheme defaults to 'http'.static_configs:- targets: ["localhost:9090"]- job_name: nodestatic_configs:- targets: ['localhost:9100'] - job_name: gateway-servicemetrics_path: '/actuator/prometheus'static_configs:- targets: ['localhost:9091']
- 启动promethus
./prometheus --config.file=prometheus.yml
10.5 prometheus-webhook-dingtalk
这是啥 干嘛的 简单说就是帮助进行发送钉钉消息的
以前的流程
promethus—>触发规则-> alterManager->进行发送
现在的流程
promethus—>触发规则-> alterManager->prometheus-webhook-dingtalk->进行发送
本来我们可以在alterManager单独配置 发送钉钉消息的webhook 但是模板消息 以及 密钥 都无法配置 (可能我的姿势不对)
所以加了一层转发 告警消息先到alterManager 然后转发给 prometheus-webhook-dingtalk prometheus-webhook-dingtalk来负责真实发送告警到钉钉
- 下载 https://github.com/timonwong/prometheus-webhook-dingtalk/releases/tag/v2.1.0
- 解压 & 配置
 ## Request timeout
# timeout: 5s## Uncomment following line in order to write template from scratch (be careful!)
#no_builtin_template: true## Customizable templates path
#templates:
#  - contrib/templates/legacy/template.tmpl## You can also override default template using `default_message`
## The following example to use the 'legacy' template from v0.3.0
#default_message:
#  title: '{{ template "legacy.title" . }}'
#  text: '{{ template "legacy.content" . }}'## Targets, previously was known as "profiles"
targets:webhook1:#钉钉机器人的地址 url: https://oapi.dingtalk.com/robot/send?access_token=xxx# 钉钉 secret for signaturesecret: xxxxx
- 启动
./prometheus-webhook-dingtalk --config.file=config.yml
10.6 进行测试
把gateway-service服务 停止掉 然后等待3分钟 (这个时间可以调整)
然后在 prometheus-webhook-dingtalk 控制台 即可看到如下日志
表示 alterManager 调用 prometheus-webhook-dingtalk 的 webhook成功了
ts=2023-02-09T11:06:21.615Z caller=entry.go:26 level=info component=web http_scheme=http http_proto=HTTP/1.1 http_method=POST remote_addr=[::1]:62467 user_agent=Alertmanager/0.25.0 uri=http://localhost:8060/dingtalk/webhook1/send resp_status=200 resp_bytes_length=2 resp_elapsed_ms=501.124351 msg="request complete"
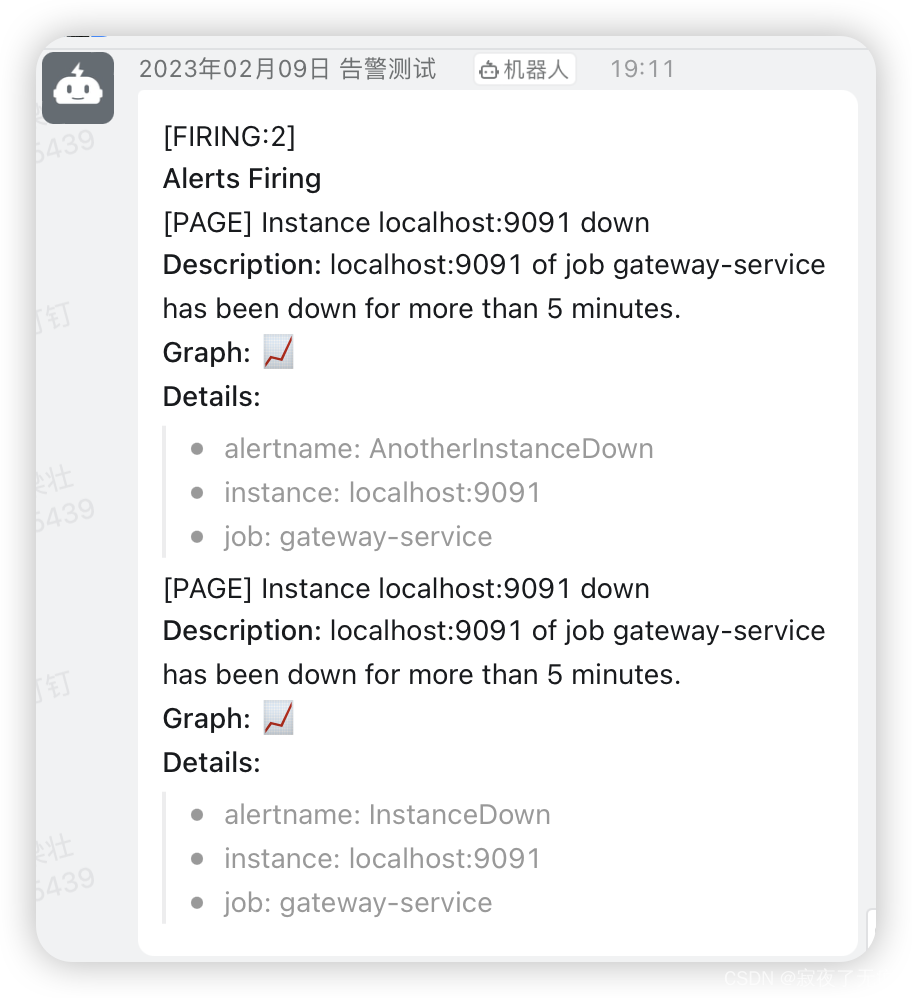
同时也可以在钉钉上收到该提示
11 tips
钉钉消息模板 还有很多 可以自行配置
另外 还可以发送 邮箱告警 等等 需要修改 alterManager的配置即可
告警的规则 还有很多 需要自行研究 也有类似的模板
promethus的扩展:https://prometheus.io/docs/operating/integrations/
promethus的官网: https://prometheus.io/